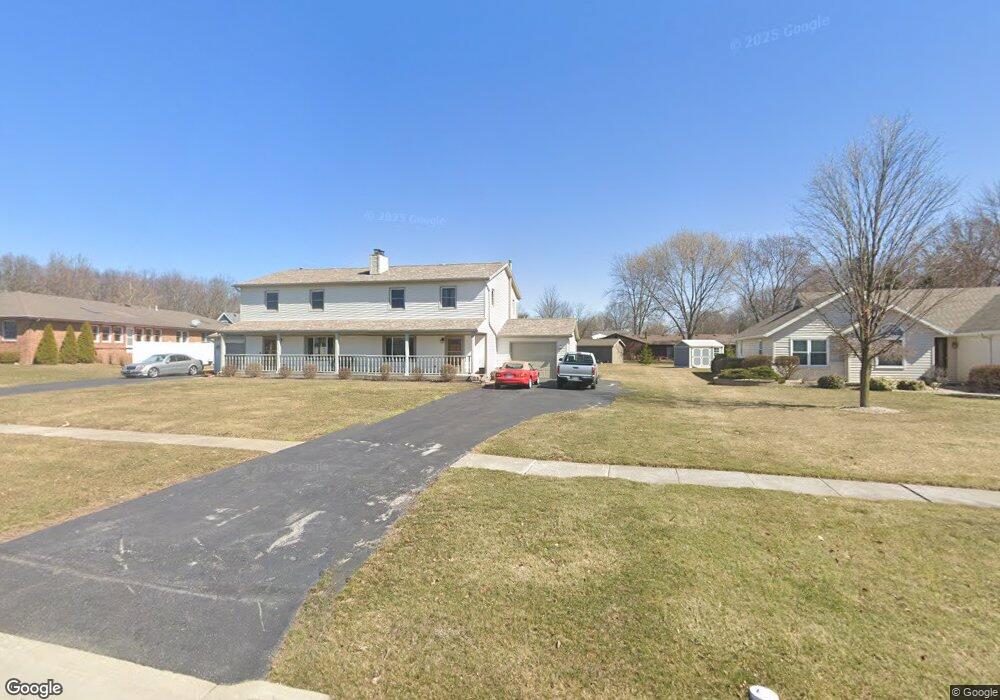
1012 Fox Run Rd Unit U2 Findlay, OH 45840
Estimated Value: $180,000 - $225,000
Studio
3
Baths
1,400
Sq Ft
$143/Sq Ft
Est. Value
About This Home
This home is located at 1012 Fox Run Rd Unit U2, Findlay, OH 45840 and is currently estimated at $200,871, approximately $143 per square foot. 1012 Fox Run Rd Unit U2 is a home located in Hancock County with nearby schools including Wilson Vance Elementary School, Whittier Elementary School, and Glenwood Middle School.
Ownership History
Date
Name
Owned For
Owner Type
Purchase Details
Closed on
Sep 8, 2004
Sold by
Williams Gary and Williams Tabatha W
Bought by
Federal National Mortgage Association
Current Estimated Value
Purchase Details
Closed on
Apr 19, 1995
Sold by
Darr Roger
Bought by
Doris Tirone
Home Financials for this Owner
Home Financials are based on the most recent Mortgage that was taken out on this home.
Original Mortgage
$77,850
Interest Rate
8.64%
Mortgage Type
New Conventional
Purchase Details
Closed on
Apr 30, 1990
Bought by
Darr Roger J
Purchase Details
Closed on
Oct 26, 1987
Bought by
Mullinger Ralph
Purchase Details
Closed on
Oct 7, 1986
Bought by
Igoe Denise A
Purchase Details
Closed on
Aug 13, 1985
Bought by
Wynkoop Randall L and Wynkoop Patti
Create a Home Valuation Report for This Property
The Home Valuation Report is an in-depth analysis detailing your home's value as well as a comparison with similar homes in the area
Home Values in the Area
Average Home Value in this Area
Purchase History
| Date | Buyer | Sale Price | Title Company |
|---|---|---|---|
| Federal National Mortgage Association | $77,500 | Whitman Title | |
| Doris Tirone | $86,500 | -- | |
| Darr Roger J | $68,200 | -- | |
| Mullinger Ralph | $63,000 | -- | |
| Igoe Denise A | $63,800 | -- | |
| Wynkoop Randall L | -- | -- |
Source: Public Records
Mortgage History
| Date | Status | Borrower | Loan Amount |
|---|---|---|---|
| Previous Owner | Doris Tirone | $77,850 |
Source: Public Records
Tax History
| Year | Tax Paid | Tax Assessment Tax Assessment Total Assessment is a certain percentage of the fair market value that is determined by local assessors to be the total taxable value of land and additions on the property. | Land | Improvement |
|---|---|---|---|---|
| 2024 | $1,702 | $47,900 | $2,800 | $45,100 |
| 2023 | $1,704 | $47,900 | $2,800 | $45,100 |
| 2022 | $1,698 | $47,900 | $2,800 | $45,100 |
| 2021 | $1,823 | $44,790 | $2,100 | $42,690 |
| 2020 | $1,823 | $44,790 | $2,100 | $42,690 |
| 2019 | $1,788 | $44,790 | $2,100 | $42,690 |
| 2018 | $1,778 | $40,910 | $2,100 | $38,810 |
| 2017 | $1,779 | $40,910 | $2,100 | $38,810 |
| 2016 | $1,757 | $40,910 | $2,100 | $38,810 |
| 2015 | $1,294 | $29,590 | $2,100 | $27,490 |
| 2014 | $1,294 | $29,590 | $2,100 | $27,490 |
| 2012 | $1,306 | $29,590 | $2,100 | $27,490 |
Source: Public Records
Map
Nearby Homes
- 845 Fox Run Rd
- 701 Red Fox Rd
- 2245 Fox Run Cir Unit 1037
- 821 Fox Run Rd Unit 6
- 1121 Fox Run Rd
- 801 Fox Run Rd
- 827 Abbey Ln
- 456 Strathaven Dr
- 2000 Rush Creek Ct
- 1926 Queenswood Dr
- 8131 Brookfield Cir
- 8457 Lakewood Dr
- 15329 E Us Route 224
- 1825 Greendale Ave
- 1203 Chateau Ct
- 0 E Us Route 224
- 1828 Queenswood Dr
- 2143 Bluestone Dr
- 1724 Queenswood Dr Unit 10 (2-C)
- 7507 Township Road 212
- 1010 Fox Run Rd Unit 1
- 2301 Foxbury Ln
- 2303 Foxbury Ln Unit U2
- 1020 Fox Run Rd
- 1023 Fox Run Road (P)
- 2417 Foxbury Ln
- 1013 Fox Run Rd
- 1011 Fox Run Rd
- 2423 Foxbury Ln
- 1023 Fox Run Rd Unit 2
- 1021 Fox Run Rd
- 2315 Foxbury Ln
- 1030 Fox Run Rd
- 1015 Fox Run Rd
- 2501 Foxbury Ln
- 1003 Fox Run Rd
- 2300 Foxbury Ln
- 1025 Fox Run Rd
- 1044 Fox Run Rd Unit 1
- 2310 Foxbury Ln
Your Personal Tour Guide
Ask me questions while you tour the home.