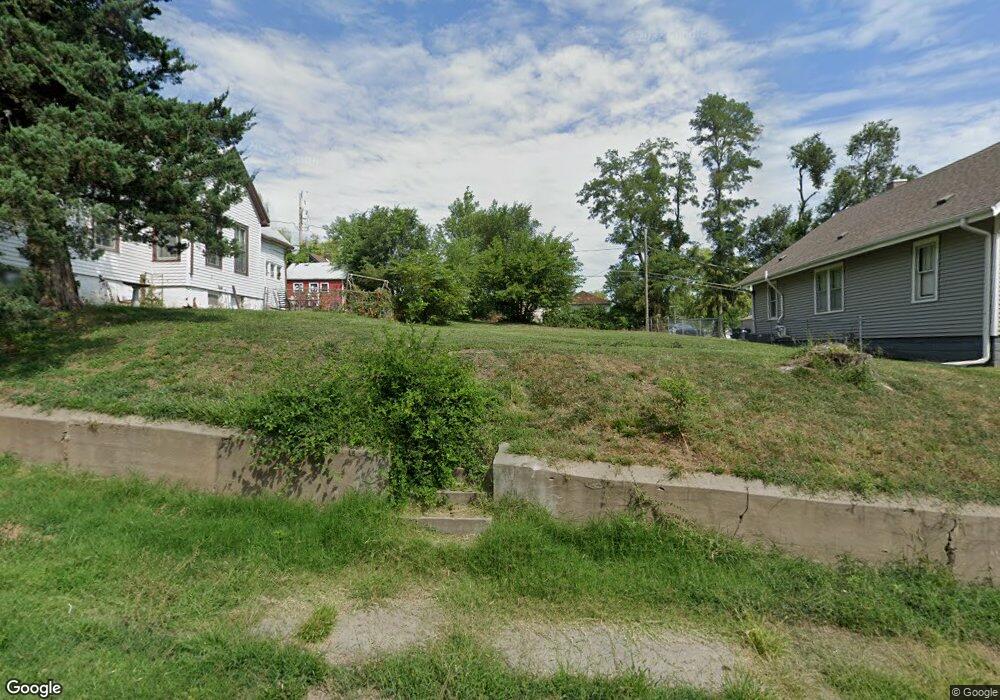
1012 Homer St Omaha, NE 68107
South Central Omaha NeighborhoodEstimated Value: $60,000 - $131,000
2
Beds
1
Bath
846
Sq Ft
$105/Sq Ft
Est. Value
About This Home
This home is located at 1012 Homer St, Omaha, NE 68107 and is currently estimated at $89,000, approximately $105 per square foot. 1012 Homer St is a home located in Douglas County with nearby schools including Spring Lake Magnet Center, R.M. Marrs Magnet Middle School, and South High School.
Ownership History
Date
Name
Owned For
Owner Type
Purchase Details
Closed on
Jun 17, 2021
Sold by
Habitat For Humanity Of Omaha Inc
Bought by
Kruse Brain K
Current Estimated Value
Purchase Details
Closed on
Jun 11, 2021
Sold by
Omaha Municipal Land Bank
Bought by
Habitat For Humanity Of Omaha Inc
Purchase Details
Closed on
Dec 1, 2016
Sold by
Habitat For Humanity Of Omaha Inc
Bought by
Omaha Municipal Land Bank
Purchase Details
Closed on
Sep 24, 2015
Sold by
Moriarty Molly Elizabeth
Bought by
Habitat For Humanity Of Omaha Inc
Create a Home Valuation Report for This Property
The Home Valuation Report is an in-depth analysis detailing your home's value as well as a comparison with similar homes in the area
Home Values in the Area
Average Home Value in this Area
Purchase History
| Date | Buyer | Sale Price | Title Company |
|---|---|---|---|
| Kruse Brain K | $5,000 | None Available | |
| Habitat For Humanity Of Omaha Inc | -- | None Available | |
| Omaha Municipal Land Bank | -- | None Available | |
| Habitat For Humanity Of Omaha Inc | -- | None Available |
Source: Public Records
Tax History Compared to Growth
Tax History
| Year | Tax Paid | Tax Assessment Tax Assessment Total Assessment is a certain percentage of the fair market value that is determined by local assessors to be the total taxable value of land and additions on the property. | Land | Improvement |
|---|---|---|---|---|
| 2024 | $325 | $15,400 | $15,400 | -- |
| 2023 | $325 | $15,400 | $15,400 | -- |
| 2022 | $327 | $15,300 | $15,300 | $0 |
| 2021 | $324 | $15,300 | $15,300 | $0 |
| 2020 | $0 | $0 | $0 | $0 |
| 2019 | $1,071 | $0 | $0 | $0 |
| 2018 | $0 | $0 | $0 | $0 |
| 2017 | $1,071 | $0 | $0 | $0 |
| 2016 | $1,071 | $49,900 | $4,600 | $45,300 |
| 2015 | $1,056 | $49,900 | $4,600 | $45,300 |
| 2014 | $1,056 | $49,900 | $4,600 | $45,300 |
Source: Public Records
Map
Nearby Homes