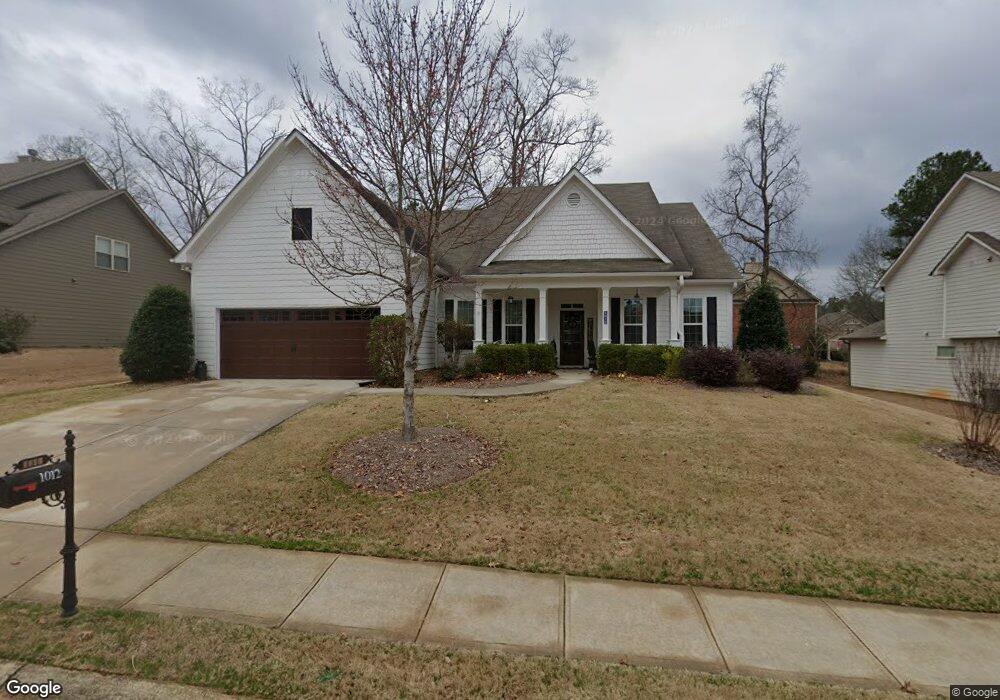
1012 Ruddy Duck Dr Unit 380 Jefferson, GA 30549
Estimated Value: $386,268 - $437,000
3
Beds
2
Baths
1,828
Sq Ft
$227/Sq Ft
Est. Value
About This Home
This home is located at 1012 Ruddy Duck Dr Unit 380, Jefferson, GA 30549 and is currently estimated at $414,567, approximately $226 per square foot. 1012 Ruddy Duck Dr Unit 380 is a home located in Jackson County with nearby schools including Jefferson Elementary School, Jefferson Academy, and Jefferson Middle School.
Ownership History
Date
Name
Owned For
Owner Type
Purchase Details
Closed on
Jun 2, 2022
Sold by
Crane Diana
Bought by
Roddy Carol
Current Estimated Value
Purchase Details
Closed on
Jan 31, 2018
Sold by
Tolbert Kimberlee
Bought by
Crane Diana
Home Financials for this Owner
Home Financials are based on the most recent Mortgage that was taken out on this home.
Original Mortgage
$216,125
Interest Rate
3.95%
Mortgage Type
New Conventional
Purchase Details
Closed on
Aug 26, 2015
Sold by
Lfw Mallard Llc
Bought by
Tolbert Kimberlee
Home Financials for this Owner
Home Financials are based on the most recent Mortgage that was taken out on this home.
Original Mortgage
$183,673
Interest Rate
4.02%
Mortgage Type
New Conventional
Purchase Details
Closed on
Sep 26, 2013
Sold by
Meridian Jefferson Llc
Bought by
Lfw Mallard Llc
Purchase Details
Closed on
Sep 11, 2013
Sold by
Westridge Partners Iii Llc
Bought by
Meridian Jefferson Llc
Create a Home Valuation Report for This Property
The Home Valuation Report is an in-depth analysis detailing your home's value as well as a comparison with similar homes in the area
Home Values in the Area
Average Home Value in this Area
Purchase History
| Date | Buyer | Sale Price | Title Company |
|---|---|---|---|
| Roddy Carol | $395,000 | -- | |
| Crane Diana | $227,500 | -- | |
| Tolbert Kimberlee | $182,500 | -- | |
| Lfw Mallard Llc | $750,000 | -- | |
| Meridian Jefferson Llc | $410,000 | -- |
Source: Public Records
Mortgage History
| Date | Status | Borrower | Loan Amount |
|---|---|---|---|
| Previous Owner | Crane Diana | $216,125 | |
| Previous Owner | Tolbert Kimberlee | $183,673 |
Source: Public Records
Tax History Compared to Growth
Tax History
| Year | Tax Paid | Tax Assessment Tax Assessment Total Assessment is a certain percentage of the fair market value that is determined by local assessors to be the total taxable value of land and additions on the property. | Land | Improvement |
|---|---|---|---|---|
| 2024 | $3,927 | $141,480 | $28,400 | $113,080 |
| 2023 | $3,900 | $127,800 | $28,400 | $99,400 |
| 2022 | $3,410 | $106,640 | $28,400 | $78,240 |
| 2021 | $3,131 | $96,240 | $18,000 | $78,240 |
| 2020 | $2,831 | $81,400 | $18,000 | $63,400 |
| 2019 | $2,873 | $81,400 | $18,000 | $63,400 |
| 2018 | $2,811 | $78,440 | $18,000 | $60,440 |
| 2017 | $2,622 | $71,698 | $18,000 | $53,698 |
| 2016 | $2,598 | $70,698 | $17,000 | $53,698 |
| 2015 | $2,291 | $62,098 | $8,400 | $53,698 |
| 2014 | $224 | $8,400 | $8,400 | $0 |
| 2013 | -- | $6,000 | $6,000 | $0 |
Source: Public Records
Map
Nearby Homes
- 150 Merganser Dr
- 1023 Ruddy Duck Dr
- 748 Hawkins Creek Dr
- 1053 Ruddy Duck Dr
- 533 Widgeon Way
- 1168 Ruddy Duck Dr
- 1233 Ruddy Duck Dr
- 864 Hawkins Creek Dr
- 105 Grand Oak Dr
- 55 Grand Oak Dr
- 1234 Oconee River Lot 4 Dr
- 1234 Oconee River Dr Unit LOT 4
- 0 Panther Dr Unit CL343172
- 0 Panther Dr Unit 10638263
- 816 Mimosa Way
- 357 Brant Cir
- 42 Brant Cir
- 584 Jefferson Walk Cir
- 302 Thornhill Cir
- 1012 Ruddy Duck Dr
- 1006 Ruddy Duck Dr
- 1005 Ruddy Duck Dr
- 1011 Ruddy Duck Dr
- 160 Merganser Dr
- 1017 Ruddy Duck Dr
- 1024 Ruddy Duck Dr
- 1024 Ruddy Duck Dr
- 181 Merganser Dr
- 191 Merganser Dr
- 747 Hawkins Creek Dr
- 201 Merganser Dr
- 151 Merganser Dr
- 721 Hawkins Creek Dr
- 200 Merganser Dr
- 1030 Ruddy Duck Dr
- 755 Hawkins Creek Dr
- 211 Merganser Dr
- 707 Hawkins Creek Dr
- 1033 Ruddy Duck Dr