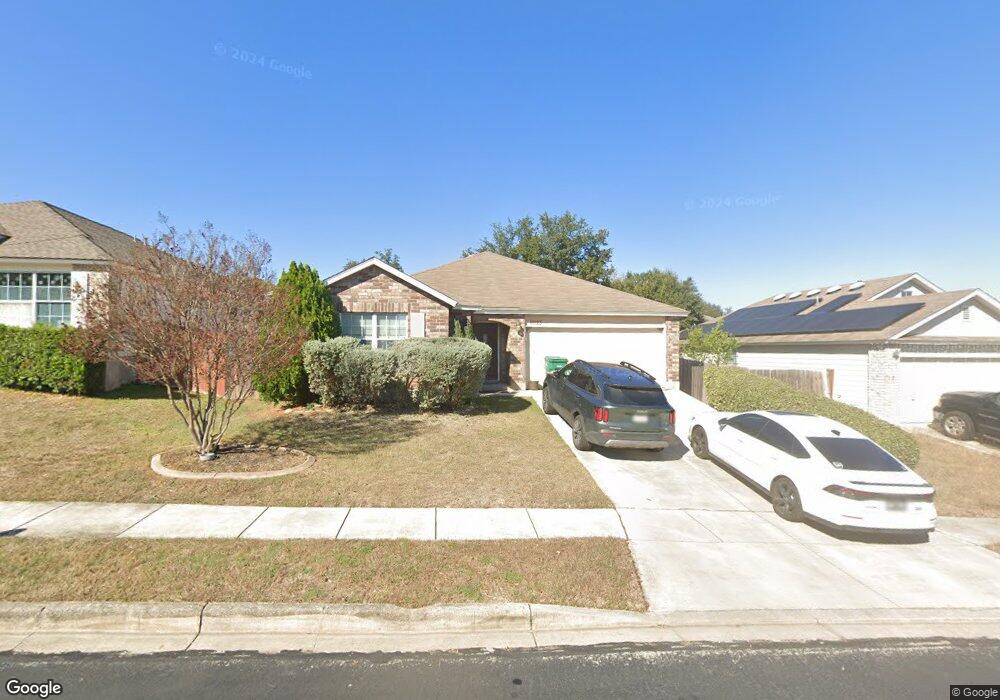
10123 Colt Crossing Converse, TX 78109
Estimated Value: $241,579 - $261,000
3
Beds
2
Baths
1,537
Sq Ft
$164/Sq Ft
Est. Value
About This Home
This home is located at 10123 Colt Crossing, Converse, TX 78109 and is currently estimated at $251,895, approximately $163 per square foot. 10123 Colt Crossing is a home located in Bexar County with nearby schools including Ricardo Salinas Elementary School, Kitty Hawk Middle School, and Veterans Memorial High School.
Ownership History
Date
Name
Owned For
Owner Type
Purchase Details
Closed on
Aug 30, 2016
Sold by
Gleitz Jeremy M and Gleitz Sarah E
Bought by
Powell Timothy L
Current Estimated Value
Home Financials for this Owner
Home Financials are based on the most recent Mortgage that was taken out on this home.
Original Mortgage
$150,750
Outstanding Balance
$124,023
Interest Rate
4.4%
Mortgage Type
FHA
Estimated Equity
$127,872
Purchase Details
Closed on
Jul 23, 2010
Sold by
Morgan Michael Matthew and Morgan Kristin R
Bought by
Gleitz Jeremy M
Home Financials for this Owner
Home Financials are based on the most recent Mortgage that was taken out on this home.
Original Mortgage
$130,738
Interest Rate
4.87%
Mortgage Type
FHA
Purchase Details
Closed on
Sep 22, 2005
Sold by
Standard Pacific Of Texas Lp
Bought by
Morgan Michael Matthew and Morgan Kristin R
Home Financials for this Owner
Home Financials are based on the most recent Mortgage that was taken out on this home.
Original Mortgage
$122,943
Interest Rate
5.76%
Mortgage Type
FHA
Create a Home Valuation Report for This Property
The Home Valuation Report is an in-depth analysis detailing your home's value as well as a comparison with similar homes in the area
Home Values in the Area
Average Home Value in this Area
Purchase History
| Date | Buyer | Sale Price | Title Company |
|---|---|---|---|
| Powell Timothy L | -- | Providence Title Company | |
| Gleitz Jeremy M | -- | Fatc Earl & Assoc | |
| Morgan Michael Matthew | -- | Stc |
Source: Public Records
Mortgage History
| Date | Status | Borrower | Loan Amount |
|---|---|---|---|
| Open | Powell Timothy L | $150,750 | |
| Previous Owner | Gleitz Jeremy M | $130,738 | |
| Previous Owner | Morgan Michael Matthew | $122,943 |
Source: Public Records
Tax History Compared to Growth
Tax History
| Year | Tax Paid | Tax Assessment Tax Assessment Total Assessment is a certain percentage of the fair market value that is determined by local assessors to be the total taxable value of land and additions on the property. | Land | Improvement |
|---|---|---|---|---|
| 2025 | $5,235 | $232,660 | $59,170 | $173,490 |
| 2024 | $5,235 | $236,950 | $59,170 | $177,780 |
| 2023 | $5,235 | $248,630 | $59,170 | $189,460 |
| 2022 | $5,345 | $224,090 | $43,070 | $181,020 |
| 2021 | $4,321 | $173,290 | $34,950 | $138,340 |
| 2020 | $4,321 | $166,470 | $37,430 | $129,040 |
| 2019 | $4,485 | $167,960 | $37,430 | $130,530 |
| 2018 | $4,216 | $157,650 | $37,430 | $120,220 |
| 2017 | $4,242 | $155,720 | $37,430 | $118,290 |
| 2016 | $4,126 | $151,470 | $37,200 | $114,270 |
| 2015 | $3,475 | $146,650 | $30,000 | $116,650 |
| 2014 | $3,475 | $134,409 | $0 | $0 |
Source: Public Records
Map
Nearby Homes
- 8502 Chickasaw Bluff
- 10229 Pony Corral
- 8503 Chickasaw Bluff
- 8418 Dusty Ridge
- 1918 Winged Rose
- 1922 Winged Rose
- 11814 Carolina Rose
- 11818 Carolina Rose
- 10815 Arbol Landing
- 8410 Apache Bend
- 8606 Chickasaw Bluff
- 312 Toepperwein Rd
- 10302 Little Sugar Creek
- 9923 Loma Alta Cir
- 9915 Windburn Trail
- 9955 Meadow Lark
- 10309 Little Sugar Creek
- 9818 Balanced Rock
- 8531 Dusty Ridge
- 8238 Comanche Pass
- 10119 Colt Crossing
- 10127 Colt Crossing
- 10210 Pony Corral
- 10131 Colt Crossing
- 10115 Colt Crossing
- 10206 Pony Corral
- 10214 Pony Corral
- 10135 Colt Crossing
- 8502 Cheyenne Bluff
- 8503 Cherokee Ridge
- 10111 Colt Crossing
- 10218 Pony Corral
- 10139 Colt Crossing
- 10202 Pony Corral
- 10222 Pony Corral
- 8501 Cheyenne Bluff
- 10107 Colt Crossing
- 8506 Cheyenne Bluff
- 10103 Colt Crossing
- 8511 Cherokee Ridge