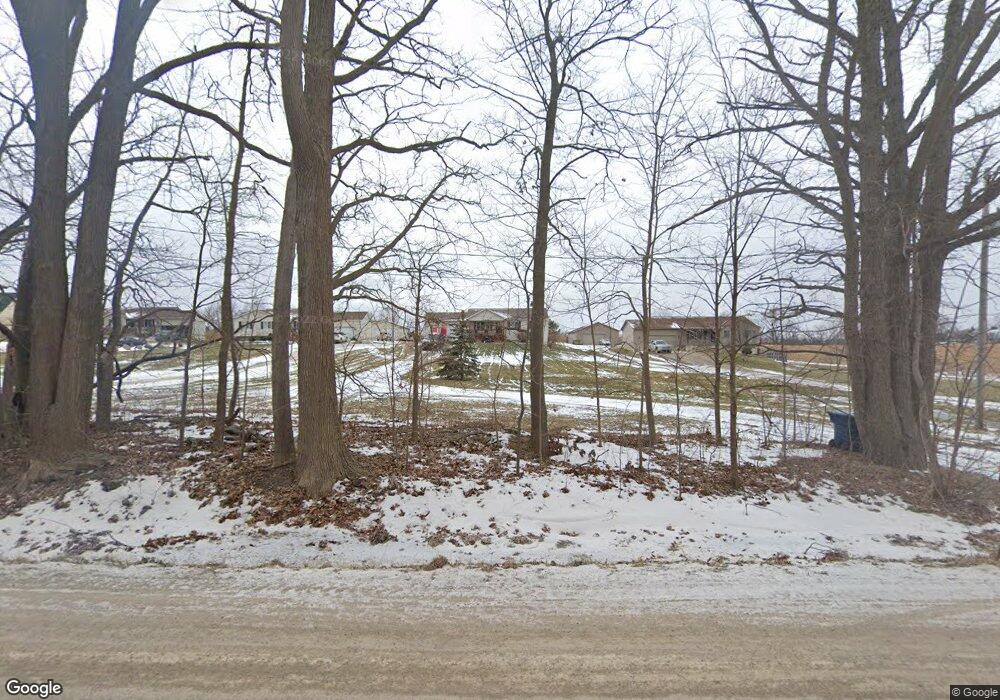
10126 Sharp Rd Swartz Creek, MI 48473
Estimated Value: $259,000 - $379,000
3
Beds
3
Baths
1,306
Sq Ft
$239/Sq Ft
Est. Value
About This Home
This home is located at 10126 Sharp Rd, Swartz Creek, MI 48473 and is currently estimated at $311,728, approximately $238 per square foot. 10126 Sharp Rd is a home located in Genesee County with nearby schools including West Shore Elementary School, Torrey Hill Intermediate School, and Lake Fenton Middle School.
Ownership History
Date
Name
Owned For
Owner Type
Purchase Details
Closed on
Jun 29, 2004
Sold by
Johns Michael and Johns Tracy
Bought by
Blackwell William
Current Estimated Value
Home Financials for this Owner
Home Financials are based on the most recent Mortgage that was taken out on this home.
Original Mortgage
$143,920
Interest Rate
7.15%
Mortgage Type
Purchase Money Mortgage
Purchase Details
Closed on
Sep 26, 2000
Sold by
Stan Baroski Builders Inc
Bought by
Johns Michael and Johns Tracy
Purchase Details
Closed on
Jul 28, 2000
Sold by
Pinkston Harley Blaine and Pinkston Jeannette
Bought by
Stan Baroski Builders Inc
Create a Home Valuation Report for This Property
The Home Valuation Report is an in-depth analysis detailing your home's value as well as a comparison with similar homes in the area
Home Values in the Area
Average Home Value in this Area
Purchase History
We collect this data history from publicly available records. To have your information removed, we recommend requesting removal directly through your county’s website.
| Date | Buyer | Sale Price | Title Company |
|---|---|---|---|
| Blackwell William | $179,900 | Lawyers Title Ins | |
| Johns Michael | $129,655 | Cislo Title Company | |
| Stan Baroski Builders Inc | $25,000 | Cislo Title Company |
Source: Public Records
Mortgage History
We collect this data history from publicly available records. To have your information removed, we recommend requesting removal directly through your county’s website.
| Date | Status | Borrower | Loan Amount |
|---|---|---|---|
| Previous Owner | Blackwell William | $143,920 | |
| Closed | Blackwell William | $35,980 |
Source: Public Records
Tax History
| Year | Tax Paid | Tax Assessment Tax Assessment Total Assessment is a certain percentage of the fair market value that is determined by local assessors to be the total taxable value of land and additions on the property. | Land | Improvement |
|---|---|---|---|---|
| 2025 | $2,652 | $143,700 | $0 | $0 |
| 2024 | $815 | $134,500 | $0 | $0 |
| 2023 | $777 | $115,700 | $0 | $0 |
| 2022 | $2,467 | $106,700 | $0 | $0 |
| 2021 | $2,446 | $101,100 | $0 | $0 |
| 2020 | $711 | $96,100 | $0 | $0 |
| 2019 | $700 | $90,500 | $0 | $0 |
| 2018 | $2,246 | $86,000 | $0 | $0 |
| 2017 | $2,147 | $82,900 | $0 | $0 |
| 2016 | $2,127 | $77,500 | $0 | $0 |
| 2015 | $1,946 | $68,200 | $0 | $0 |
| 2014 | $645 | $59,700 | $0 | $0 |
| 2012 | -- | $53,900 | $53,900 | $0 |
Source: Public Records
Map
Nearby Homes
- 10150 Sharp Rd
- 10310 Sharp Rd
- 6520 Cook Rd
- 11360 Linden Rd
- 5042 Cook Rd
- 7395 Baldwin Rd
- 0 W Ray Rd
- 8410 Linden Rd
- 4357 Drake Dr
- 4140 Cook Rd
- VL Grand Blanc Rd
- 00 Grand Blanc Rd
- 8107 Linden Rd
- 7502 Skylar Ct
- 3341 W Baldwin Rd
- 7494 Skylar Ct
- 7465 Skylar Ct
- 7377 Grandwood Dr
- 7357 Ponderosa Dr
- 12521 Sharp Rd
- 10114 Sharp Rd
- 10138 Sharp Rd
- 10090 Sharp Rd
- 10162 Sharp Rd
- 10182 Sharp Rd
- 10194 Sharp Rd Unit Bldg-Unit
- 10194 Sharp Rd
- 10131 Sharp Rd
- 10061 Sharp Rd
- 10061 Sharp Rd
- 10061 Sharp Rd
- 10061 Sharp Rd
- 10061 Sharp Rd
- 10200 Sharp Rd
- 10147 Sharp Rd
- 10051 Sharp Rd
- 10041 Sharp Rd
- 10220 Sharp Rd
- 10159 Sharp Rd
- 10031 Sharp Rd
Your Personal Tour Guide
Ask me questions while you tour the home.