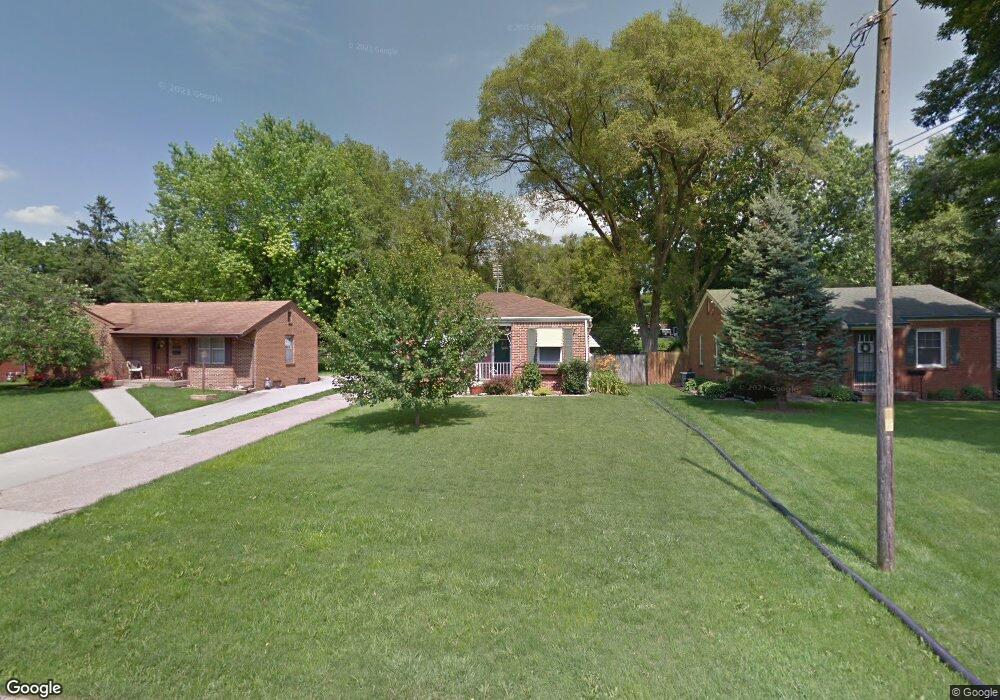
1013 66th St Windsor Heights, IA 50324
Estimated Value: $204,675 - $228,000
2
Beds
1
Bath
805
Sq Ft
$270/Sq Ft
Est. Value
About This Home
This home is located at 1013 66th St, Windsor Heights, IA 50324 and is currently estimated at $217,669, approximately $270 per square foot. 1013 66th St is a home located in Polk County with nearby schools including Windsor Elementary School, Merrill Middle School, and Roosevelt High School.
Ownership History
Date
Name
Owned For
Owner Type
Purchase Details
Closed on
Apr 12, 1999
Sold by
Hansen Heather P and Hansen Susan C
Bought by
Farrell Rick M
Current Estimated Value
Home Financials for this Owner
Home Financials are based on the most recent Mortgage that was taken out on this home.
Original Mortgage
$94,124
Outstanding Balance
$23,462
Interest Rate
7.1%
Mortgage Type
FHA
Estimated Equity
$194,207
Purchase Details
Closed on
Jul 10, 1998
Sold by
Egan John G and Egan Katherine E
Bought by
Hansen Heather P and Hansen Susan C
Home Financials for this Owner
Home Financials are based on the most recent Mortgage that was taken out on this home.
Original Mortgage
$81,131
Interest Rate
7.17%
Mortgage Type
FHA
Create a Home Valuation Report for This Property
The Home Valuation Report is an in-depth analysis detailing your home's value as well as a comparison with similar homes in the area
Home Values in the Area
Average Home Value in this Area
Purchase History
| Date | Buyer | Sale Price | Title Company |
|---|---|---|---|
| Farrell Rick M | $94,500 | -- | |
| Hansen Heather P | $81,000 | -- |
Source: Public Records
Mortgage History
| Date | Status | Borrower | Loan Amount |
|---|---|---|---|
| Open | Farrell Rick M | $94,124 | |
| Previous Owner | Hansen Heather P | $81,131 |
Source: Public Records
Tax History
| Year | Tax Paid | Tax Assessment Tax Assessment Total Assessment is a certain percentage of the fair market value that is determined by local assessors to be the total taxable value of land and additions on the property. | Land | Improvement |
|---|---|---|---|---|
| 2025 | $3,272 | $206,700 | $59,800 | $146,900 |
| 2024 | $3,272 | $184,900 | $52,900 | $132,000 |
| 2023 | $3,162 | $184,900 | $52,900 | $132,000 |
| 2022 | $3,136 | $151,200 | $44,200 | $107,000 |
| 2021 | $3,068 | $151,200 | $44,200 | $107,000 |
| 2020 | $3,190 | $136,600 | $39,800 | $96,800 |
| 2019 | $3,222 | $136,600 | $39,800 | $96,800 |
| 2018 | $3,148 | $127,600 | $36,500 | $91,100 |
| 2017 | $2,978 | $127,600 | $36,500 | $91,100 |
| 2016 | $2,820 | $117,600 | $33,200 | $84,400 |
| 2015 | $2,820 | $117,600 | $33,200 | $84,400 |
| 2014 | $2,544 | $110,400 | $30,600 | $79,800 |
Source: Public Records
Map
Nearby Homes
- 948 65th St
- 6750 School St Unit 205
- 1008 67th St
- 1206 68th St
- 6423 Carpenter Ave
- 6428 Elmcrest Dr
- 1320 66th St
- 1403 66th St
- 1122 59th St
- 6131 Harwood Dr
- 686 63rd St
- 6002 Rollins Ave
- 5815 Kingman Ave
- 1407 64th St
- 1233 72nd St
- 6008 Carpenter Ave
- 5716 Kingman Ave
- 1051 57th St
- 1337 60th St
- 3927 Westgate Pkwy
Your Personal Tour Guide
Ask me questions while you tour the home.