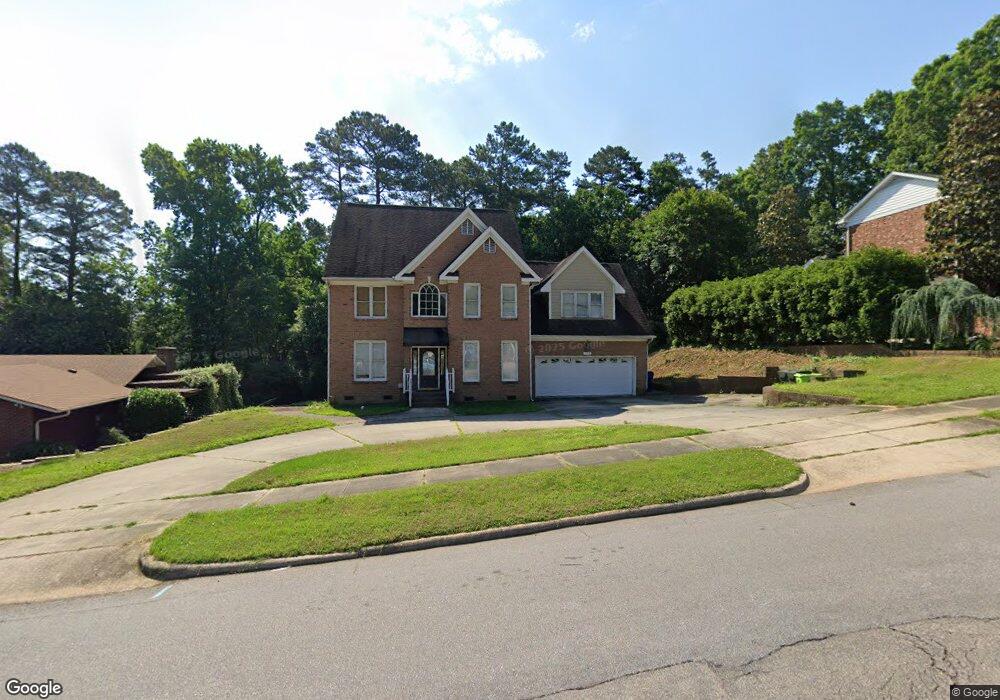
1013 Deboy St Raleigh, NC 27606
Avent West NeighborhoodEstimated Value: $575,000 - $723,000
4
Beds
4
Baths
2,700
Sq Ft
$242/Sq Ft
Est. Value
About This Home
This home is located at 1013 Deboy St, Raleigh, NC 27606 and is currently estimated at $654,546, approximately $242 per square foot. 1013 Deboy St is a home located in Wake County with nearby schools including Adams Elementary, Lufkin Road Middle School, and Atlas International School.
Ownership History
Date
Name
Owned For
Owner Type
Purchase Details
Closed on
Jun 22, 2022
Sold by
1013 Deboy Street Trust
Bought by
Shi Xiaolin
Current Estimated Value
Purchase Details
Closed on
Jan 2, 2019
Sold by
Shi Xiaolin
Bought by
1013 Deboy Street Trust
Purchase Details
Closed on
Dec 6, 2016
Sold by
Services Of Carolina Llc
Bought by
Shi Xiaolin
Purchase Details
Closed on
Mar 1, 2007
Sold by
Debnam Winnie Rebecca A
Bought by
Niemchak Peter J and Niemchak Rebecca D
Purchase Details
Closed on
Feb 16, 2004
Sold by
Edwards Deborah Louise
Bought by
Debnam Winnie Rebecca A
Purchase Details
Closed on
Dec 22, 2003
Sold by
Edwards Deborah Louise Debnam
Bought by
Debnam Winnie Rebecca
Purchase Details
Closed on
Dec 5, 1995
Bought by
Niemchak Rebecca D and Niemchak Peter J
Create a Home Valuation Report for This Property
The Home Valuation Report is an in-depth analysis detailing your home's value as well as a comparison with similar homes in the area
Home Values in the Area
Average Home Value in this Area
Purchase History
| Date | Buyer | Sale Price | Title Company |
|---|---|---|---|
| Shi Xiaolin | -- | None Listed On Document | |
| 1013 Deboy Street Trust | -- | None Available | |
| 1013 Deboy Street Trust | -- | None Listed On Document | |
| Shi Xiaolin | $300,253 | None Available | |
| Niemchak Peter J | -- | None Available | |
| Debnam Winnie Rebecca A | -- | -- | |
| Debnam Winnie Rebecca | -- | -- | |
| Niemchak Rebecca D | $12,500 | -- |
Source: Public Records
Tax History Compared to Growth
Tax History
| Year | Tax Paid | Tax Assessment Tax Assessment Total Assessment is a certain percentage of the fair market value that is determined by local assessors to be the total taxable value of land and additions on the property. | Land | Improvement |
|---|---|---|---|---|
| 2025 | $4,550 | $519,393 | $165,000 | $354,393 |
| 2024 | $5,035 | $577,384 | $165,000 | $412,384 |
| 2023 | $4,344 | $396,684 | $100,000 | $296,684 |
| 2022 | $4,036 | $396,684 | $100,000 | $296,684 |
| 2021 | $3,880 | $396,684 | $100,000 | $296,684 |
| 2020 | $3,809 | $396,684 | $100,000 | $296,684 |
| 2019 | $3,787 | $325,091 | $100,000 | $225,091 |
| 2018 | $3,572 | $325,091 | $100,000 | $225,091 |
| 2017 | $3,402 | $325,091 | $100,000 | $225,091 |
| 2016 | $3,332 | $325,091 | $100,000 | $225,091 |
| 2015 | $3,329 | $319,556 | $100,000 | $219,556 |
| 2014 | $3,157 | $319,556 | $100,000 | $219,556 |
Source: Public Records
Map
Nearby Homes
- 1212 Schaub Dr Unit C
- 1208 Schaub Dr Unit B
- 1010 Sandlin Place Unit D
- 1008 Sandlin Place Unit J
- 1010 Sandlin Place Unit C
- 1277 Teakwood Place
- 1115 Bayfield Dr
- 905 Deboy St
- 3916 Wendy Ln Unit 8B2
- 3952 Wendy Ln
- 901 Deboy St
- 5016 Centerbud Place
- 715 Powell Dr
- 613 Powell Dr
- 611 Powell Dr
- 618 Powell Dr
- 722 Powell Dr
- 712 Grayhaven Place
- 724 Powell Dr
- Lot 14 Grayhaven Place
- 1017 Deboy St
- 1110 Schaub Dr Unit J
- 1110 Schaub Dr Unit I
- 1110 Schaub Dr Unit H
- 1110 Schaub Dr Unit G
- 1110 Schaub Dr Unit F
- 1110 Schaub Dr Unit E
- 1110 Schaub Dr Unit C
- 1110 Schaub Dr Unit A
- 1110 Schaub Dr Unit MC
- 1110 Schaub Dr
- 1021 Deboy St
- 1008 Deboy St
- 1012 Deboy St
- 1005 Deboy St
- 1016 Deboy St
- 1004 Deboy St
- 1114 Schaub Dr Unit K
- 1114 Schaub Dr Unit J
- 1114 Schaub Dr Unit I