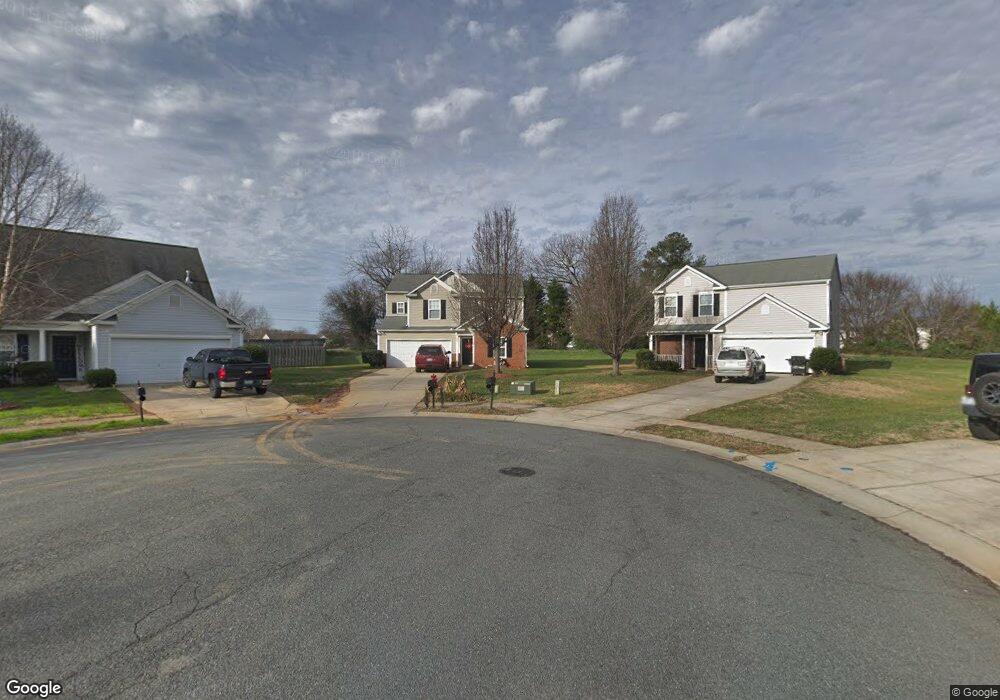
1013 Fort Clapsop Ct Monroe, NC 28110
Estimated Value: $412,327 - $439,000
4
Beds
3
Baths
2,159
Sq Ft
$196/Sq Ft
Est. Value
About This Home
This home is located at 1013 Fort Clapsop Ct, Monroe, NC 28110 and is currently estimated at $422,332, approximately $195 per square foot. 1013 Fort Clapsop Ct is a home located in Union County with nearby schools including Shiloh Valley Primary School, Shiloh Valley Elementary School, and Sun Valley Middle School.
Ownership History
Date
Name
Owned For
Owner Type
Purchase Details
Closed on
Feb 8, 2010
Sold by
Secretary Of Housing & Urban Development
Bought by
Merida Araceli
Current Estimated Value
Home Financials for this Owner
Home Financials are based on the most recent Mortgage that was taken out on this home.
Original Mortgage
$132,173
Outstanding Balance
$87,746
Interest Rate
5.25%
Mortgage Type
FHA
Estimated Equity
$334,586
Purchase Details
Closed on
Nov 18, 2009
Sold by
Pfenninger Kenneth and Pfenninger Annemarie
Bought by
Secretary Of Housing & Urban Development
Purchase Details
Closed on
Nov 6, 2002
Sold by
Colony Homes Llc
Bought by
Pfenninger Kenneth and Pfenninger Annemarie
Home Financials for this Owner
Home Financials are based on the most recent Mortgage that was taken out on this home.
Original Mortgage
$143,677
Interest Rate
5.93%
Mortgage Type
FHA
Purchase Details
Closed on
Jun 4, 2002
Sold by
The Mulvaney Group Ltd
Bought by
Colony Homes Llc and Colony Homes Of North Carolina Llc
Create a Home Valuation Report for This Property
The Home Valuation Report is an in-depth analysis detailing your home's value as well as a comparison with similar homes in the area
Purchase History
| Date | Buyer | Sale Price | Title Company |
|---|---|---|---|
| Merida Araceli | -- | None Available | |
| Secretary Of Housing & Urban Development | $149,609 | None Available | |
| Pfenninger Kenneth | $146,000 | -- | |
| Colony Homes Llc | $155,000 | -- |
Source: Public Records
Mortgage History
| Date | Status | Borrower | Loan Amount |
|---|---|---|---|
| Open | Merida Araceli | $132,173 | |
| Previous Owner | Pfenninger Kenneth | $143,677 |
Source: Public Records
Tax History
| Year | Tax Paid | Tax Assessment Tax Assessment Total Assessment is a certain percentage of the fair market value that is determined by local assessors to be the total taxable value of land and additions on the property. | Land | Improvement |
|---|---|---|---|---|
| 2025 | $2,892 | $433,100 | $0 | $0 |
| 2024 | $2,328 | $271,900 | $38,100 | $233,800 |
| 2023 | $2,297 | $271,900 | $38,100 | $233,800 |
| 2022 | $2,248 | $271,900 | $38,100 | $233,800 |
| 2021 | $2,246 | $271,900 | $38,100 | $233,800 |
| 2020 | $1,254 | $159,900 | $21,500 | $138,400 |
| 2019 | $1,618 | $159,900 | $21,500 | $138,400 |
| 2018 | $1,269 | $159,900 | $21,500 | $138,400 |
| 2017 | $1,698 | $159,900 | $21,500 | $138,400 |
| 2016 | $1,651 | $159,900 | $21,500 | $138,400 |
| 2015 | $1,328 | $159,900 | $21,500 | $138,400 |
| 2014 | $1,148 | $162,840 | $28,000 | $134,840 |
Source: Public Records
Map
Nearby Homes
- 4710 Titus Ct
- 2006 Great Falls Dr
- 2507 Devon Dr
- 4003 Salmon River Dr
- 3035 Proverbs Ct
- 6004 Brook Valley Run
- 6002 Brook Valley Run
- 1110 Hinson Forest Rd
- 1035 Barnette Farm Ln
- 1032 Barnette Farm Ln
- 104 Pine Lake Dr
- 2127 Genesis Dr
- 200 Sidney Ct
- 3043 Streamlet Way
- 2111 Genesis Dr
- 5303 Rogers Rd
- 3085 Counselors Dr
- 1333 Kristy Lynn Dr
- 5412 Fulton Ridge Dr
- 1112 Harkey Creek Dr
- 1011 Fort Clapsop Ct
- 1008 Fort Clapsop Ct
- 4824 Rogers Rd
- 1009 Fort Clapsop Ct
- 1006 Fort Clapsop Ct
- 4814 Rogers Rd
- 1007 Fort Clapsop Ct
- 1004 Fort Clapsop Ct
- 1009 Bitter Root Ct
- 1002 Fort Clapsop Ct
- 1011 Bitter Root Ct
- 1005 Fort Clapsop Ct
- 1005 Fort Clapsop Ct
- 4810 Mossy Cup Ln
- 4808 Mossy Cup Ln
- 1000 Fort Clapsop Ct
- 1000 Fort Clapsop Ct Unit 394
- 1005 Bitter Root Ct
- 3004 William Clark Trail
- 3006 William Clark Trail
Your Personal Tour Guide
Ask me questions while you tour the home.