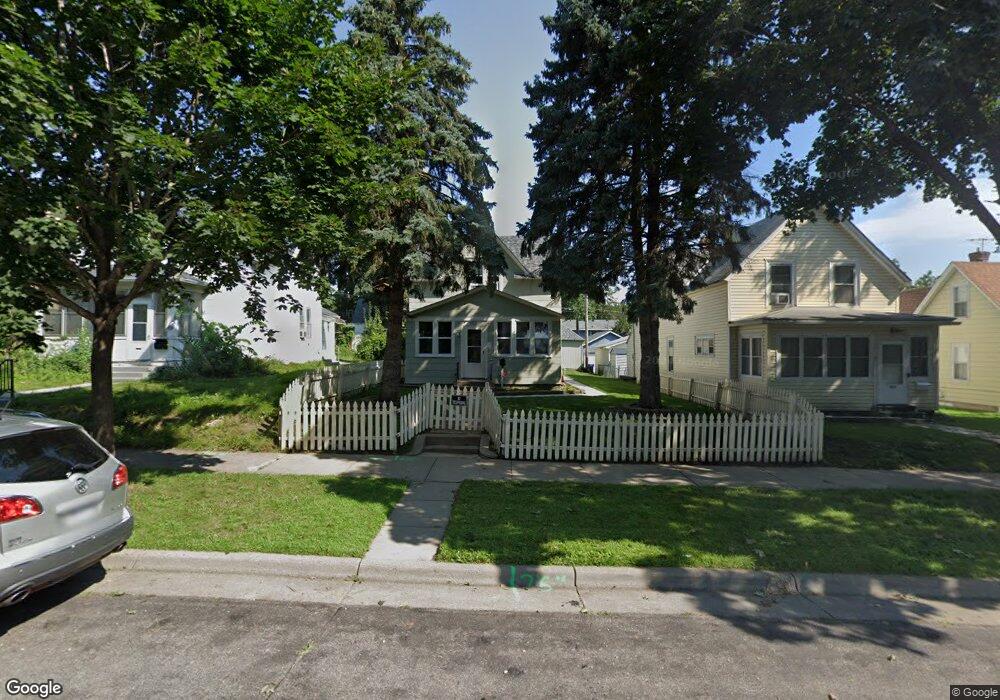
1013 Magnolia Ave E Saint Paul, MN 55106
Payne-Phalen NeighborhoodEstimated Value: $197,000 - $214,000
2
Beds
2
Baths
1,067
Sq Ft
$194/Sq Ft
Est. Value
About This Home
This home is located at 1013 Magnolia Ave E, Saint Paul, MN 55106 and is currently estimated at $207,284, approximately $194 per square foot. 1013 Magnolia Ave E is a home located in Ramsey County with nearby schools including Frost Lake Elementary School, Battle Creek Middle School, and Johnson Senior High School.
Ownership History
Date
Name
Owned For
Owner Type
Purchase Details
Closed on
Aug 23, 2017
Sold by
E O D Enterprises Llc
Bought by
Banderas Herrera Berney Jacil and Banderas Lindsay
Current Estimated Value
Home Financials for this Owner
Home Financials are based on the most recent Mortgage that was taken out on this home.
Original Mortgage
$125,910
Outstanding Balance
$105,062
Interest Rate
3.96%
Mortgage Type
New Conventional
Estimated Equity
$102,222
Purchase Details
Closed on
Mar 2, 2009
Sold by
Mers
Bought by
Mcdonald Jason
Purchase Details
Closed on
Sep 25, 2001
Sold by
Japha Partnership
Bought by
Sahar Masoud
Purchase Details
Closed on
Sep 19, 2001
Sold by
Sahor Masoud and Sahor Michele L
Bought by
Alatriste Jose
Purchase Details
Closed on
Jan 5, 2001
Sold by
Japha Partnership
Bought by
Sahar Masoud
Create a Home Valuation Report for This Property
The Home Valuation Report is an in-depth analysis detailing your home's value as well as a comparison with similar homes in the area
Home Values in the Area
Average Home Value in this Area
Purchase History
We collect this data history from publicly available records. To have your information removed, we recommend requesting removal directly through your county’s website.
| Date | Buyer | Sale Price | Title Company |
|---|---|---|---|
| Banderas Herrera Berney Jacil | $143,939 | Fsa Title Services Llc | |
| Mcdonald Jason | $27,500 | -- | |
| Sahar Masoud | $68,271 | -- | |
| Alatriste Jose | $108,900 | -- | |
| Sahar Masoud | $65,203 | -- |
Source: Public Records
Mortgage History
We collect this data history from publicly available records. To have your information removed, we recommend requesting removal directly through your county’s website.
| Date | Status | Borrower | Loan Amount |
|---|---|---|---|
| Open | Banderas Herrera Berney Jacil | $125,910 | |
| Closed | Sahar Masoud | -- |
Source: Public Records
Tax History
| Year | Tax Paid | Tax Assessment Tax Assessment Total Assessment is a certain percentage of the fair market value that is determined by local assessors to be the total taxable value of land and additions on the property. | Land | Improvement |
|---|---|---|---|---|
| 2025 | $4,108 | $200,300 | $25,000 | $175,300 |
| 2023 | $4,108 | $195,600 | $20,000 | $175,600 |
| 2022 | $3,386 | $189,500 | $20,000 | $169,500 |
| 2021 | $2,890 | $162,800 | $20,000 | $142,800 |
| 2020 | $2,488 | $149,000 | $9,900 | $139,100 |
| 2019 | $2,330 | $139,200 | $9,900 | $129,300 |
| 2018 | $1,854 | $125,000 | $9,900 | $115,100 |
| 2017 | $1,952 | $101,000 | $9,900 | $91,100 |
| 2016 | $1,804 | $0 | $0 | $0 |
| 2015 | $1,740 | $89,400 | $9,900 | $79,500 |
| 2014 | $1,628 | $0 | $0 | $0 |
Source: Public Records
Map
Nearby Homes
- 1041 Magnolia Ave E
- 1087 Magnolia Ave E
- 945 Geranium Ave E
- 1110 Magnolia Ave E
- 916 Magnolia Ave E
- 959 Jenks Ave
- 1109 Lawson Ave E
- 1135 Magnolia Ave E
- 1105 Rose Ave E
- 915 Rose Ave E
- 911 Jenks Ave E
- 1095 Maryland Ave E
- 941 Cypress St
- 895 Rose Ave E
- 893 Jenks Ave
- 1111 Maryland Ave E
- 930 Hawthorne Ave E
- 869 Lawson Ave E
- 1158 Lawson Ave E
- 1106 Hawthorne Ave E
- 1013 1013 Magnolia Ave E
- 1013 1013 Magnolia-Avenue-e
- 1017 Magnolia Ave E
- 1017 1017 Magnolia-Avenue-e
- 1021 1021 Magnolia-Avenue-e
- 1003 Magnolia Ave E
- 1003 Magnolia Ave E Unit 2
- 1021 Magnolia Ave E
- 1012 Jessamine Ave E
- 1016 Jessamine Ave E
- 1008 Jessamine Ave E
- 1029 Magnolia Ave E
- 1020 Jessamine Ave E
- 1000 Jessamine Ave E
- 1026 Jessamine Ave E
- 1020 1020 Magnolia Ave E
- 1012 Magnolia Ave E
- 1004 Jessamine Ave E
- 1016 Magnolia Ave E
- 1033 1033 Magnolia Ave E
Your Personal Tour Guide
Ask me questions while you tour the home.