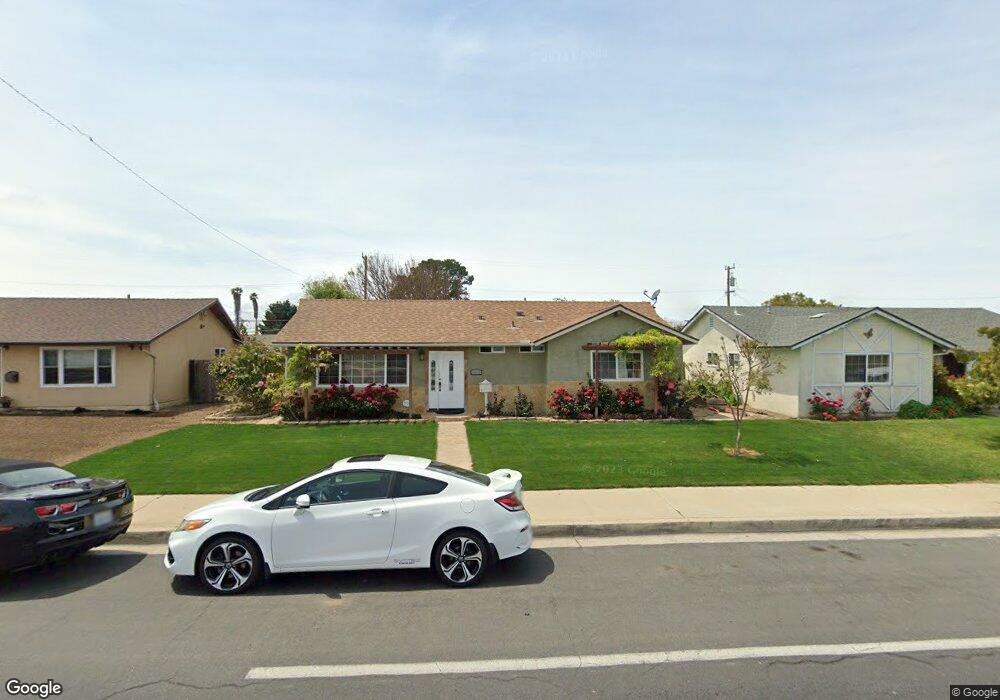
1013 N O St Lompoc, CA 93436
Estimated Value: $406,000 - $609,000
3
Beds
2
Baths
1,538
Sq Ft
$349/Sq Ft
Est. Value
About This Home
This home is located at 1013 N O St, Lompoc, CA 93436 and is currently estimated at $536,411, approximately $348 per square foot. 1013 N O St is a home located in Santa Barbara County with nearby schools including La Canada Elementary School, Lompoc Valley Middle School, and Lompoc High School.
Ownership History
Date
Name
Owned For
Owner Type
Purchase Details
Closed on
Dec 29, 1997
Sold by
Mcgibbon John R
Bought by
Bueno Rodolfo and Bueno Alma O
Current Estimated Value
Home Financials for this Owner
Home Financials are based on the most recent Mortgage that was taken out on this home.
Original Mortgage
$107,924
Outstanding Balance
$18,714
Interest Rate
7.13%
Estimated Equity
$517,697
Purchase Details
Closed on
Aug 4, 1995
Sold by
Mcgibbon John R and Mcgibbon Sabra R
Bought by
Mcgibbon John Robert and Mcgibb Sabra Ruth
Create a Home Valuation Report for This Property
The Home Valuation Report is an in-depth analysis detailing your home's value as well as a comparison with similar homes in the area
Home Values in the Area
Average Home Value in this Area
Purchase History
We collect this data history from publicly available records. To have your information removed, we recommend requesting removal directly through your county’s website.
| Date | Buyer | Sale Price | Title Company |
|---|---|---|---|
| Bueno Rodolfo | $109,000 | First American Title | |
| Mcgibbon John Robert | -- | -- |
Source: Public Records
Mortgage History
We collect this data history from publicly available records. To have your information removed, we recommend requesting removal directly through your county’s website.
| Date | Status | Borrower | Loan Amount |
|---|---|---|---|
| Open | Bueno Rodolfo | $107,924 |
Source: Public Records
Tax History
| Year | Tax Paid | Tax Assessment Tax Assessment Total Assessment is a certain percentage of the fair market value that is determined by local assessors to be the total taxable value of land and additions on the property. | Land | Improvement |
|---|---|---|---|---|
| 2025 | $1,850 | $235,139 | $94,815 | $140,324 |
| 2023 | $1,850 | $167,182 | $81,327 | $85,855 |
| 2022 | $1,813 | $163,905 | $79,733 | $84,172 |
| 2021 | $1,831 | $160,692 | $78,170 | $82,522 |
| 2020 | $1,811 | $159,045 | $77,369 | $81,676 |
| 2019 | $1,779 | $155,927 | $75,852 | $80,075 |
| 2018 | $1,749 | $152,870 | $74,365 | $78,505 |
| 2017 | $1,716 | $149,873 | $72,907 | $76,966 |
| 2016 | $1,683 | $146,935 | $71,478 | $75,457 |
| 2014 | $1,644 | $141,895 | $69,026 | $72,869 |
Source: Public Records
Map
Nearby Homes
- 923 N N Place
- 1213 Iris Ct
- 1249 Westbrook Dr
- 1257 Stonebrook Dr
- 1248 Stonebrook Dr
- 1309 Stonebrook Dr
- 1444 Village Meadows Dr
- 1308 Jason Dr
- 1513 W Lemon Ave
- 904 W College Ave
- 1340 Jason Dr
- 526 N L St
- 1116 N Y St
- 1504 W Airport Ave
- 516 N U St
- 1407 N H St
- 1621 W Pine Ave
- 921 N Z St
- 100 California 1
- 1114 Point Sal Loop
Your Personal Tour Guide
Ask me questions while you tour the home.