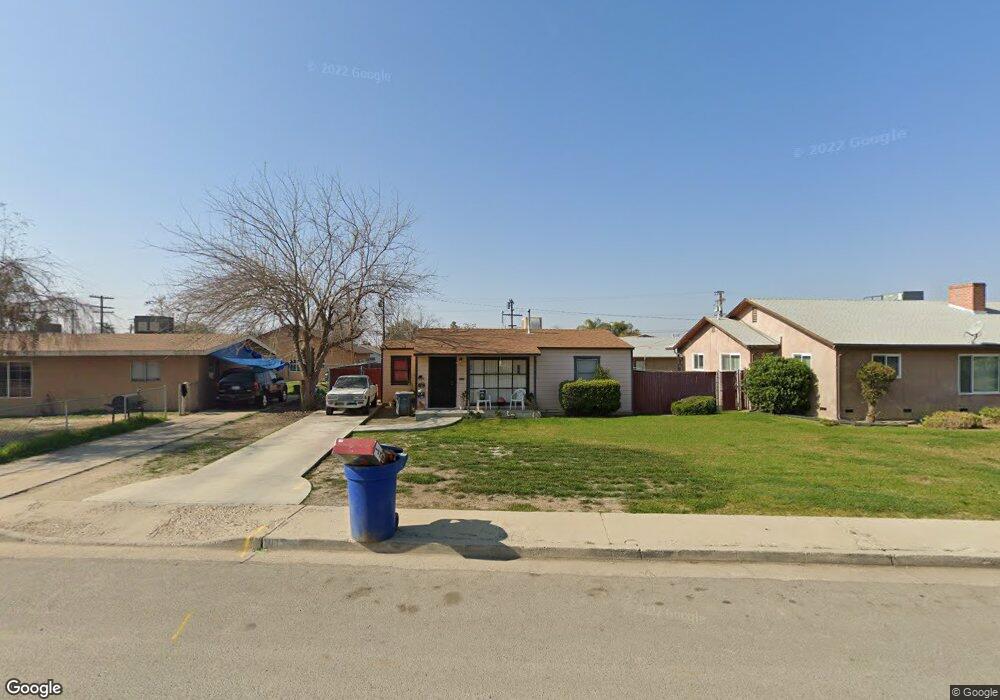
1013 Princeton St Delano, CA 93215
East Delano NeighborhoodEstimated Value: $149,000 - $212,687
2
Beds
1
Bath
780
Sq Ft
$238/Sq Ft
Est. Value
About This Home
This home is located at 1013 Princeton St, Delano, CA 93215 and is currently estimated at $185,422, approximately $237 per square foot. 1013 Princeton St is a home located in Kern County with nearby schools including Cesar E. Chavez High School, Del Vista Math And Science Academy, and Cecil Avenue Math & Science Academy.
Ownership History
Date
Name
Owned For
Owner Type
Purchase Details
Closed on
Aug 24, 2023
Sold by
Lara Anjelina
Bought by
Lara Vincent D
Current Estimated Value
Home Financials for this Owner
Home Financials are based on the most recent Mortgage that was taken out on this home.
Original Mortgage
$125,000
Outstanding Balance
$122,297
Interest Rate
7.09%
Mortgage Type
New Conventional
Estimated Equity
$63,125
Purchase Details
Closed on
Dec 13, 2022
Sold by
Lara Anthony John
Bought by
Lara Anthony J and Lara Vincent D
Purchase Details
Closed on
May 23, 2022
Sold by
Church Of Our Saviour Lutheran
Bought by
Lara Anthony John
Home Financials for this Owner
Home Financials are based on the most recent Mortgage that was taken out on this home.
Original Mortgage
$97,500
Interest Rate
5.1%
Mortgage Type
New Conventional
Create a Home Valuation Report for This Property
The Home Valuation Report is an in-depth analysis detailing your home's value as well as a comparison with similar homes in the area
Home Values in the Area
Average Home Value in this Area
Purchase History
| Date | Buyer | Sale Price | Title Company |
|---|---|---|---|
| Lara Vincent D | -- | Placer Title | |
| Lara Anthony J | -- | -- | |
| Lara Anthony John | $130,000 | Ticor Title |
Source: Public Records
Mortgage History
| Date | Status | Borrower | Loan Amount |
|---|---|---|---|
| Open | Lara Vincent D | $125,000 | |
| Previous Owner | Lara Anthony John | $97,500 |
Source: Public Records
Tax History Compared to Growth
Tax History
| Year | Tax Paid | Tax Assessment Tax Assessment Total Assessment is a certain percentage of the fair market value that is determined by local assessors to be the total taxable value of land and additions on the property. | Land | Improvement |
|---|---|---|---|---|
| 2025 | $1,658 | $135,252 | $31,212 | $104,040 |
| 2024 | $1,611 | $132,600 | $30,600 | $102,000 |
| 2023 | $1,611 | $130,000 | $30,000 | $100,000 |
| 2022 | $387 | $20,321 | $8,117 | $12,204 |
| 2021 | $330 | $19,923 | $7,958 | $11,965 |
| 2020 | $330 | $19,720 | $7,877 | $11,843 |
| 2019 | $306 | $19,720 | $7,877 | $11,843 |
| 2018 | $303 | $18,956 | $7,572 | $11,384 |
| 2017 | $305 | $18,585 | $7,424 | $11,161 |
| 2016 | $301 | $18,222 | $7,279 | $10,943 |
| 2015 | $309 | $17,949 | $7,170 | $10,779 |
| 2014 | $293 | $17,598 | $7,030 | $10,568 |
Source: Public Records
Map
Nearby Homes
- 1518 9th Ave
- 1216 10th Ave
- 1201 Quincy St
- 800 Lexington St Unit 27
- 800 Lexington St Unit 3
- 800 Lexington St Unit 28
- 1510 14th Ave
- 1115 Lexington St
- 0 Lexington St
- 601 11th Ave
- 1223 Kensington St
- 0 Cecil Ave
- 1328 5th Place
- 1732 17th Ave
- 1736 17th Ave
- 631 Union St
- 1901 6th Ave
- 621 Union St
- 0 S High St
- 1725 17th Place
- 1017 Princeton St
- 1007 Princeton St
- 1515 10th Ave
- 1511 10th Ave
- 1014 Oxford St
- 1018 Oxford St
- 1016 Princeton St
- 1012 Princeton St
- 1006 Princeton St
- 1020 Princeton St
- 1022 Oxford St
- 1024 Princeton St
- 1012 Oxford St
- 1607 10th Ave
- 1028 Princeton St
- 1015 Thomas Way
- 1011 Thomas Way
- 1032 Princeton St
- 1516 10th Ave
- 1019 Thomas Way