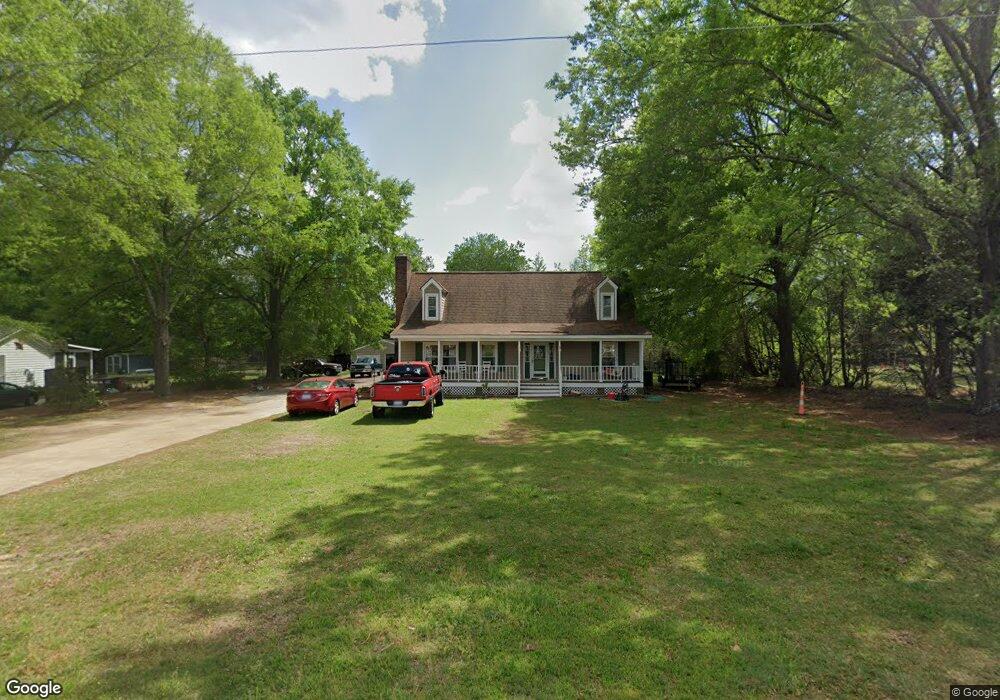
1013 Robinfield Dr Raleigh, NC 27603
South Raleigh NeighborhoodEstimated Value: $305,000 - $365,967
3
Beds
3
Baths
1,700
Sq Ft
$202/Sq Ft
Est. Value
About This Home
This home is located at 1013 Robinfield Dr, Raleigh, NC 27603 and is currently estimated at $342,992, approximately $201 per square foot. 1013 Robinfield Dr is a home located in Wake County with nearby schools including Rand Road Elementary, North Garner Middle, and South Garner High.
Ownership History
Date
Name
Owned For
Owner Type
Purchase Details
Closed on
Jun 24, 2010
Sold by
Robison Patricia and Robison Paul Matthew
Bought by
Johnson Brian R
Current Estimated Value
Home Financials for this Owner
Home Financials are based on the most recent Mortgage that was taken out on this home.
Original Mortgage
$166,836
Outstanding Balance
$111,484
Interest Rate
4.91%
Mortgage Type
New Conventional
Estimated Equity
$231,508
Purchase Details
Closed on
Jun 12, 2009
Sold by
Robison Patricia
Bought by
Robison Patricia and Robison Paul Matthew
Purchase Details
Closed on
Jul 13, 2005
Sold by
Varner Robert D and Varner Wendy W
Bought by
Robison Patricia
Purchase Details
Closed on
Jul 12, 2005
Sold by
Wilson Bradley
Bought by
Robison Patricia
Create a Home Valuation Report for This Property
The Home Valuation Report is an in-depth analysis detailing your home's value as well as a comparison with similar homes in the area
Home Values in the Area
Average Home Value in this Area
Purchase History
| Date | Buyer | Sale Price | Title Company |
|---|---|---|---|
| Johnson Brian R | $164,000 | Fidelity Natl Title Ins Co | |
| Robison Patricia | -- | None Available | |
| Robison Patricia | $150,000 | -- | |
| Robison Patricia | -- | -- |
Source: Public Records
Mortgage History
| Date | Status | Borrower | Loan Amount |
|---|---|---|---|
| Open | Johnson Brian R | $166,836 |
Source: Public Records
Tax History
| Year | Tax Paid | Tax Assessment Tax Assessment Total Assessment is a certain percentage of the fair market value that is determined by local assessors to be the total taxable value of land and additions on the property. | Land | Improvement |
|---|---|---|---|---|
| 2025 | $2,083 | $322,467 | $100,000 | $222,467 |
| 2024 | $2,023 | $322,467 | $100,000 | $222,467 |
Source: Public Records
Map
Nearby Homes
- 1129 Robinfield Dr
- 1320 Greenbranch Ln
- 1409 Porchlight Ct
- 1001 Bellewood Farms Rd
- 9912 Sauls Rd
- 5600 Cardinal Landing Dr
- 5928 Swales Way
- 1417 Harvey Johnson Rd
- 1012 Catsby Cir
- 6009 Swales Way
- 5824 Carriage Gate Dr
- 5865 Carriage Gate Dr
- 5864 Carriage Gate Dr
- 4709 Sandy Bay Cir
- 424 Thorny Branch Dr
- 6104 Wolverhampton Dr
- 1200 Kinleywood Ct
- 5904 Cir
- 2049 McBurnie Dr
- 468 Thorny Branch Dr
- 1017 Robinfield Dr
- 1009 Robinfield Dr
- 1008 Robinfield Dr
- 1021 Robinfield Dr
- 729 S Meadow Rd
- 1005 Robinfield Dr
- 1016 Robinfield Dr
- 1020 Robinfield Dr
- 801 S Meadow Rd
- 805 S Meadow Rd
- 1024 Robinfield Dr
- 9224 Sauls Rd
- 809 S Meadow Rd
- 725 S Meadow Rd
- 1025 Robinfield Dr
- 9220 Sauls Rd
- 813 S Meadow Rd
- 721 S Meadow Rd
- 9304 Sauls Rd
Your Personal Tour Guide
Ask me questions while you tour the home.