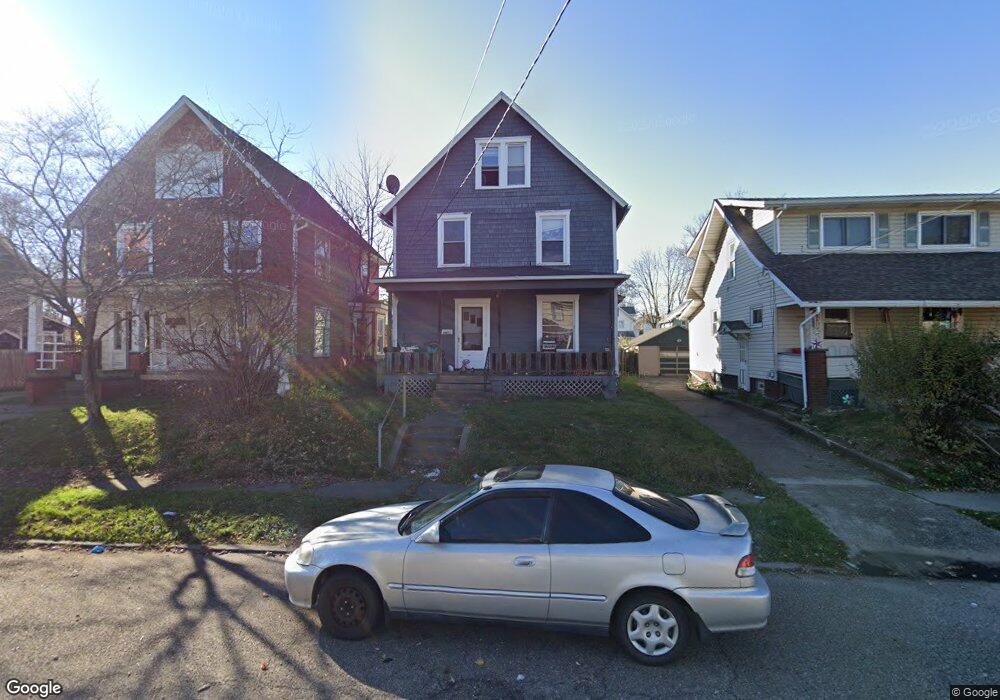
1013 Smith Ave SW Canton, OH 44706
Southwest Canton NeighborhoodEstimated Value: $60,000 - $155,000
2
Beds
2
Baths
1,440
Sq Ft
$74/Sq Ft
Est. Value
About This Home
This home is located at 1013 Smith Ave SW, Canton, OH 44706 and is currently estimated at $107,000, approximately $74 per square foot. 1013 Smith Ave SW is a home located in Stark County with nearby schools including Early Learning Center @ Schreiber, Cedar Elementary School, and McGregor Elementary School.
Ownership History
Date
Name
Owned For
Owner Type
Purchase Details
Closed on
Mar 21, 2022
Sold by
Gemstone Properties Incorporated
Bought by
Zabileta Wendy J Arellanos
Current Estimated Value
Purchase Details
Closed on
Feb 21, 2012
Sold by
Wilson Ricky Don
Bought by
Gemstone Properties Incorporated
Purchase Details
Closed on
Jan 4, 2008
Sold by
Fannie Mae
Bought by
Wilson Ricky Don and Wilson Ricky D
Purchase Details
Closed on
Oct 9, 2007
Sold by
Vorhies Susan K
Bought by
Fanniemae and Federal National Mortgage Association
Purchase Details
Closed on
Nov 6, 1997
Sold by
Delong Bethel
Bought by
Vorhies Susan K
Home Financials for this Owner
Home Financials are based on the most recent Mortgage that was taken out on this home.
Original Mortgage
$20,000
Interest Rate
7.42%
Mortgage Type
New Conventional
Purchase Details
Closed on
Sep 15, 1992
Create a Home Valuation Report for This Property
The Home Valuation Report is an in-depth analysis detailing your home's value as well as a comparison with similar homes in the area
Home Values in the Area
Average Home Value in this Area
Purchase History
| Date | Buyer | Sale Price | Title Company |
|---|---|---|---|
| Zabileta Wendy J Arellanos | -- | None Listed On Document | |
| Gemstone Properties Incorporated | -- | None Available | |
| Wilson Ricky Don | $18,000 | Ohio Title Corp | |
| Fanniemae | $34,000 | None Available | |
| Vorhies Susan K | $20,000 | -- | |
| -- | $50,000 | -- |
Source: Public Records
Mortgage History
| Date | Status | Borrower | Loan Amount |
|---|---|---|---|
| Previous Owner | Vorhies Susan K | $20,000 |
Source: Public Records
Tax History
| Year | Tax Paid | Tax Assessment Tax Assessment Total Assessment is a certain percentage of the fair market value that is determined by local assessors to be the total taxable value of land and additions on the property. | Land | Improvement |
|---|---|---|---|---|
| 2025 | -- | $2,560 | $2,560 | -- |
| 2024 | -- | $2,560 | $2,560 | -- |
| 2023 | $338 | $1,650 | $1,650 | -- |
| 2022 | $199 | $3,260 | $3,260 | $0 |
| 2021 | $416 | $6,870 | $3,260 | $3,610 |
| 2020 | $765 | $11,380 | $2,730 | $8,650 |
| 2019 | $665 | $11,380 | $2,730 | $8,650 |
Source: Public Records
Map
Nearby Homes
- 1030 Arlington Ave SW
- 1114 Bedford Ave SW
- 1021 Greenfield Ave SW
- 906 Harrison Ave SW
- 2515 Grigsby Place SW
- 1134 Clarendon Ave SW
- 2519 12th St SW
- 644 Arlington Ave SW
- 1227 Greenfield Ave SW
- 1241 Bedford Ave SW
- 1115 Dueber Ave SW
- 1215 Dueber Ave SW
- 1219 Dueber Ave SW
- 929 Wertz Ave SW
- 2911 7th St SW
- 719 Prospect Ave SW
- 3029 7th St SW
- 1225 Concord Ave SW
- 1031 Camden Ave SW
- 921 Camden Ave SW
- 1009 Smith Ave SW
- 1005 Smith Ave SW
- 1021 Smith Ave SW
- 1001 Smith Ave SW
- 1025 Smith Ave SW
- 2310 10th St SW
- 1008 Smith Ave SW
- 1012 Smith Ave SW
- 2314 10th St SW
- 1016 Smith Ave SW
- 1029 Smith Ave SW
- 1026 Smith Ave SW
- 1004 Smith Ave SW
- 1012 Arlington Ave SW
- 1016 Arlington Ave SW
- 1020 Smith Ave SW
- 1000 Smith Ave SW
- 1008 Arlington Ave SW
- 1022 Arlington Ave SW
- 1033 Smith Ave SW
Your Personal Tour Guide
Ask me questions while you tour the home.