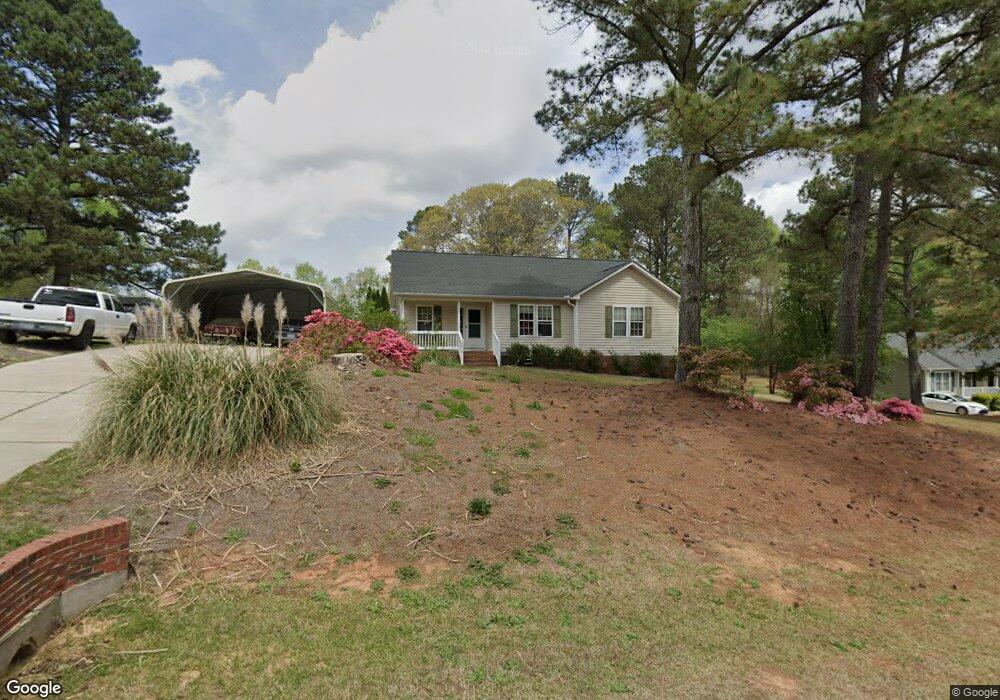
1013 Stonewater Dr Raleigh, NC 27603
Estimated Value: $300,000 - $347,000
3
Beds
2
Baths
1,333
Sq Ft
$243/Sq Ft
Est. Value
About This Home
This home is located at 1013 Stonewater Dr, Raleigh, NC 27603 and is currently estimated at $323,567, approximately $242 per square foot. 1013 Stonewater Dr is a home located in Wake County with nearby schools including North Garner Middle and Garner High.
Ownership History
Date
Name
Owned For
Owner Type
Purchase Details
Closed on
Sep 19, 2011
Sold by
U S Bank Na
Bought by
Thomas Peter
Current Estimated Value
Home Financials for this Owner
Home Financials are based on the most recent Mortgage that was taken out on this home.
Original Mortgage
$86,735
Outstanding Balance
$59,735
Interest Rate
4.38%
Mortgage Type
FHA
Estimated Equity
$263,832
Purchase Details
Closed on
May 2, 2011
Sold by
Dorman Charles and Dorman Tracy
Bought by
U S Bank National Association
Purchase Details
Closed on
Jun 29, 2000
Sold by
Rrl Rental Properties Inc
Bought by
Dorman Charles and Dorman Tracy
Home Financials for this Owner
Home Financials are based on the most recent Mortgage that was taken out on this home.
Original Mortgage
$116,602
Interest Rate
12.3%
Purchase Details
Closed on
Mar 26, 1999
Sold by
Lee Ron R
Bought by
Rrl Rental Properties Inc
Home Financials for this Owner
Home Financials are based on the most recent Mortgage that was taken out on this home.
Original Mortgage
$91,134
Interest Rate
6.74%
Create a Home Valuation Report for This Property
The Home Valuation Report is an in-depth analysis detailing your home's value as well as a comparison with similar homes in the area
Home Values in the Area
Average Home Value in this Area
Purchase History
| Date | Buyer | Sale Price | Title Company |
|---|---|---|---|
| Thomas Peter | $89,000 | Chicago Title Insurance Co | |
| U S Bank National Association | $111,560 | None Available | |
| Dorman Charles | $115,500 | -- | |
| Rrl Rental Properties Inc | -- | -- | |
| Lee Ron R | -- | -- |
Source: Public Records
Mortgage History
| Date | Status | Borrower | Loan Amount |
|---|---|---|---|
| Open | Thomas Peter | $86,735 | |
| Previous Owner | Dorman Charles | $116,602 | |
| Previous Owner | Lee Ron R | $91,134 |
Source: Public Records
Tax History Compared to Growth
Tax History
| Year | Tax Paid | Tax Assessment Tax Assessment Total Assessment is a certain percentage of the fair market value that is determined by local assessors to be the total taxable value of land and additions on the property. | Land | Improvement |
|---|---|---|---|---|
| 2025 | $1,856 | $286,990 | $80,000 | $206,990 |
| 2024 | $1,802 | $286,990 | $80,000 | $206,990 |
| 2023 | $1,494 | $189,028 | $46,000 | $143,028 |
| 2022 | $1,385 | $189,028 | $46,000 | $143,028 |
| 2021 | $1,348 | $189,028 | $46,000 | $143,028 |
| 2020 | $1,326 | $189,028 | $46,000 | $143,028 |
| 2019 | $1,199 | $144,300 | $42,000 | $102,300 |
| 2018 | $1,103 | $144,300 | $42,000 | $102,300 |
| 2017 | $1,046 | $144,300 | $42,000 | $102,300 |
| 2016 | $1,025 | $144,300 | $42,000 | $102,300 |
| 2015 | $1,035 | $146,114 | $44,000 | $102,114 |
| 2014 | $981 | $146,114 | $44,000 | $102,114 |
Source: Public Records
Map
Nearby Homes
- 272 Travel Lite Dr
- 120 Line Dr
- 392 Travel Lite Dr
- 408 Johnston Rd
- 6408 Glen Brack Ct
- 170 Sallyport Ct
- 6908 Longridge Dr
- 221 Old Hickory Dr
- 1153 Polo Dr
- 595 Durwood Dr
- 618 Durwood Dr
- 6257 Oak Passage Dr
- 6313 Southern Charm Ln
- 4212 Rockside Hills Dr
- 6121 Catandpolly Ln
- 48 Banbury Ct
- 1004 Snow Peak Ct
- 212 Fox Pen Dr
- 6009 Swales Way
- 7508 Frasier Fir Place
- 1017 Stonewater Dr
- 1009 Stonewater Dr
- 1021 Stonewater Dr
- 1005 Stonewater Dr
- 1012 Stonewater Dr
- 1016 Stonewater Dr
- 7016 Field Hill Rd
- 6708 Oviedo Dr
- 1025 Stonewater Dr
- LOT 69 Stonewater Dr
- 1001 Stonewater Dr
- 6705 Vernie Dr
- 6712 Oviedo Dr
- 1004 Stonewater Dr
- 2221 Mary Hobby Rd
- 6824 Arlington Oaks Trail
- 6720 Oviedo Dr
- 7012 Field Hill Rd
- 6709 Vernie Dr
- 6821 Arlington Oaks Trail