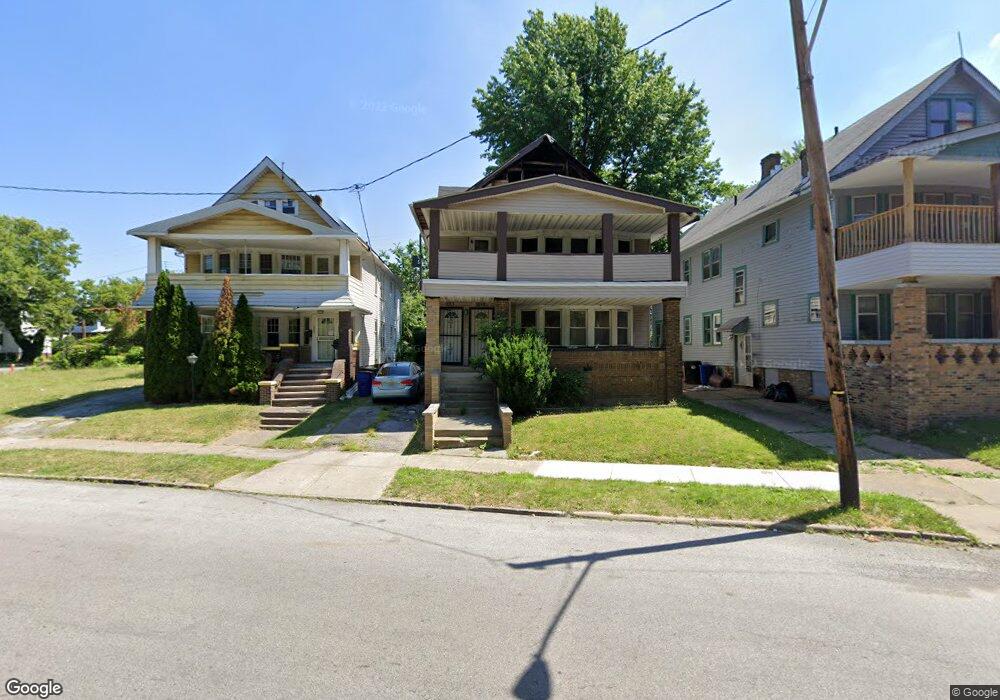
1013 Thornhill Dr Cleveland, OH 44108
Forest Hills NeighborhoodEstimated Value: $77,237 - $120,000
7
Beds
3
Baths
2,864
Sq Ft
$32/Sq Ft
Est. Value
About This Home
This home is located at 1013 Thornhill Dr, Cleveland, OH 44108 and is currently estimated at $91,559, approximately $31 per square foot. 1013 Thornhill Dr is a home located in Cuyahoga County with nearby schools including Bolton, Anton Grdina School, and Andrew J. Rickoff School.
Ownership History
Date
Name
Owned For
Owner Type
Purchase Details
Closed on
Jan 5, 2003
Sold by
Pruitt Gregory D and Pruitt Mary
Bought by
Lawrence Robert
Current Estimated Value
Purchase Details
Closed on
Dec 15, 1988
Sold by
Lumpkin Kenneth
Bought by
Pruitt Gregory
Purchase Details
Closed on
Mar 5, 1984
Sold by
Lee Anna Bell
Bought by
Lumpkin Kenneth
Purchase Details
Closed on
Jun 28, 1983
Bought by
Scott Clarence
Purchase Details
Closed on
Sep 10, 1982
Sold by
Lee Anna Bell
Bought by
Amer Hgwy Corp
Purchase Details
Closed on
Jul 1, 1982
Sold by
Shivers Gary L
Bought by
Lee Anna Bell
Purchase Details
Closed on
Jun 9, 1981
Sold by
Lee Anna B
Bought by
Shivers Gary L
Purchase Details
Closed on
Aug 13, 1979
Bought by
Lee Anna B
Purchase Details
Closed on
May 3, 1979
Sold by
Koonce Annie D
Bought by
Washington Fed Sav
Purchase Details
Closed on
Oct 12, 1977
Sold by
Koonce Walter H and Koonce Annie
Bought by
Koonce Annie D
Purchase Details
Closed on
Jan 1, 1975
Bought by
Koonce Walter H and Koonce Annie
Create a Home Valuation Report for This Property
The Home Valuation Report is an in-depth analysis detailing your home's value as well as a comparison with similar homes in the area
Home Values in the Area
Average Home Value in this Area
Purchase History
| Date | Buyer | Sale Price | Title Company |
|---|---|---|---|
| Lawrence Robert | $55,000 | Executive Title Agency Corp | |
| Pruitt Gregory | $53,500 | -- | |
| Lumpkin Kenneth | $3,500 | -- | |
| Lee Anna Bell | $1,000 | -- | |
| American Highway Corp | -- | -- | |
| Scott Clarence | $25,000 | -- | |
| Amer Hgwy Corp | -- | -- | |
| Lee Anna Bell | -- | -- | |
| Shivers Gary L | $21,000 | -- | |
| Lee Anna B | $7,500 | -- | |
| Washington Fed Sav | $7,000 | -- | |
| Koonce Annie D | -- | -- | |
| Koonce Walter H | -- | -- |
Source: Public Records
Tax History Compared to Growth
Tax History
| Year | Tax Paid | Tax Assessment Tax Assessment Total Assessment is a certain percentage of the fair market value that is determined by local assessors to be the total taxable value of land and additions on the property. | Land | Improvement |
|---|---|---|---|---|
| 2024 | $702 | $10,500 | $4,130 | $6,370 |
| 2023 | $611 | $7,880 | $2,170 | $5,710 |
| 2022 | $607 | $7,880 | $2,170 | $5,710 |
| 2021 | $602 | $7,880 | $2,170 | $5,710 |
| 2020 | $572 | $6,480 | $1,790 | $4,690 |
| 2019 | $530 | $18,500 | $5,100 | $13,400 |
| 2018 | $528 | $6,480 | $1,790 | $4,690 |
| 2017 | $400 | $4,730 | $2,240 | $2,490 |
| 2016 | $2,881 | $4,730 | $2,240 | $2,490 |
| 2015 | $822 | $4,730 | $2,240 | $2,490 |
| 2014 | $822 | $5,260 | $2,490 | $2,770 |
Source: Public Records
Map
Nearby Homes
- 1003 Eddy Rd
- 915 Eddy Rd
- 1069 Carlyon Rd
- 990 E 129th St
- 974 E 129th St
- 885 Eddy Rd
- 986 E 130th St
- 937 Parkway Rd
- 12329 Fairport Ave
- 12616 Arlington Ave
- 853 E 128th St
- 878 E 130th St
- 12517 Arlington Ave
- 1007 E 131st St
- 12528 Edmonton Ave
- 12337 Chesterfield Ave
- 850 E 131st St
- 11705 Fairport Ave
- 1184 Melbourne Rd
- 1521 Lakefront Ave
- 1021 Thornhill Dr
- 1009 Thornhill Dr
- 1027 Thornhill Dr
- 1005 Thornhill Dr
- 1029 Thornhill Dr
- 1004 Eddy Rd
- 1001 Thornhill Dr
- 1001 1003 Thornhill Dr
- 996 Eddy Rd
- 1008 Eddy Rd
- 992 Eddy Rd
- 1033 Thornhill Dr
- 1012 Eddy Rd
- 1016 Eddy Rd
- 1037 Thornhill Dr
- 993 Thornhill Dr
- 1092 Eddy Rd
- 1041 Thornhill Dr
- 974 Eddy Rd
- 989 Thornhill Dr