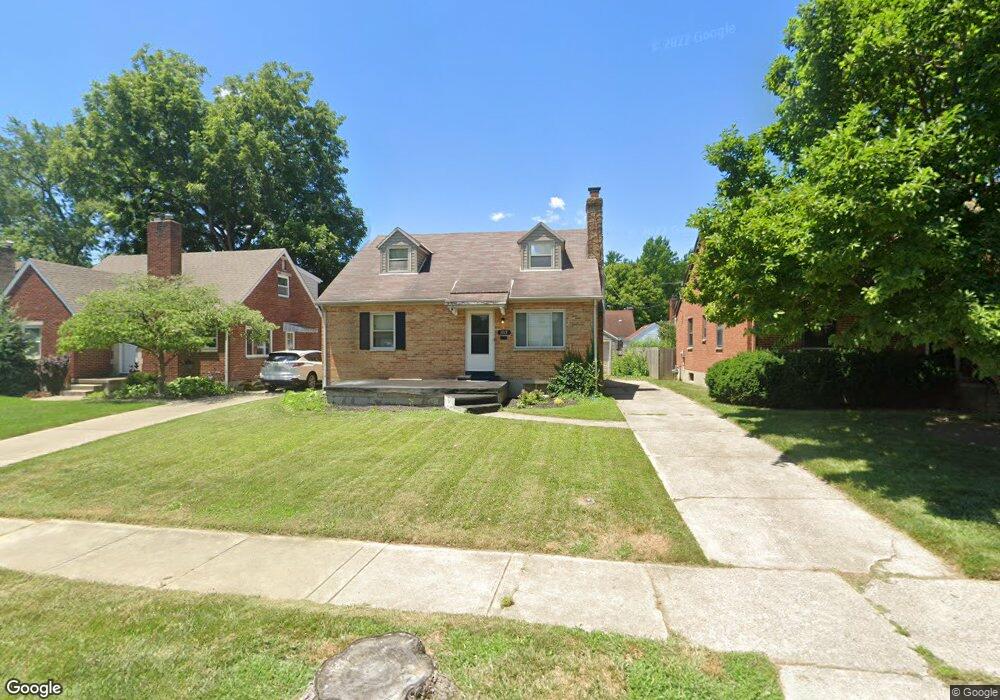
1013 Tudor Rd Dayton, OH 45419
Shroyer Park NeighborhoodEstimated Value: $206,000 - $239,000
4
Beds
2
Baths
1,344
Sq Ft
$169/Sq Ft
Est. Value
About This Home
This home is located at 1013 Tudor Rd, Dayton, OH 45419 and is currently estimated at $227,540, approximately $169 per square foot. 1013 Tudor Rd is a home located in Montgomery County with nearby schools including Horace Mann Elementary School, Cleveland Elementary School, and Eastmont Elementary.
Ownership History
Date
Name
Owned For
Owner Type
Purchase Details
Closed on
Nov 21, 2015
Sold by
Barson Mario A and Barson Katherine Marie
Bought by
Grote Raynaldo
Current Estimated Value
Home Financials for this Owner
Home Financials are based on the most recent Mortgage that was taken out on this home.
Original Mortgage
$98,188
Outstanding Balance
$77,203
Interest Rate
3.78%
Mortgage Type
FHA
Estimated Equity
$150,337
Purchase Details
Closed on
Sep 23, 2005
Sold by
Bockrath Douglas J and Bockrath Erin C
Bought by
Barson Mario A
Home Financials for this Owner
Home Financials are based on the most recent Mortgage that was taken out on this home.
Original Mortgage
$131,437
Interest Rate
5.88%
Mortgage Type
FHA
Purchase Details
Closed on
Nov 30, 1996
Sold by
Pitzer John W and Pitzer Marjorie
Bought by
Bockrath Douglas J and Bockrath Erin C
Create a Home Valuation Report for This Property
The Home Valuation Report is an in-depth analysis detailing your home's value as well as a comparison with similar homes in the area
Home Values in the Area
Average Home Value in this Area
Purchase History
| Date | Buyer | Sale Price | Title Company |
|---|---|---|---|
| Grote Raynaldo | $100,000 | Sterling Title Inc | |
| Barson Mario A | -- | -- | |
| Bockrath Douglas J | $83,400 | -- |
Source: Public Records
Mortgage History
| Date | Status | Borrower | Loan Amount |
|---|---|---|---|
| Open | Grote Raynaldo | $98,188 | |
| Previous Owner | Barson Mario A | $131,437 |
Source: Public Records
Tax History Compared to Growth
Tax History
| Year | Tax Paid | Tax Assessment Tax Assessment Total Assessment is a certain percentage of the fair market value that is determined by local assessors to be the total taxable value of land and additions on the property. | Land | Improvement |
|---|---|---|---|---|
| 2024 | $3,284 | $58,760 | $11,490 | $47,270 |
| 2023 | $3,284 | $58,760 | $11,490 | $47,270 |
| 2022 | $3,034 | $41,960 | $8,200 | $33,760 |
| 2021 | $3,018 | $41,960 | $8,200 | $33,760 |
| 2020 | $3,013 | $41,960 | $8,200 | $33,760 |
| 2019 | $2,973 | $37,240 | $7,450 | $29,790 |
| 2018 | $2,977 | $37,240 | $7,450 | $29,790 |
| 2017 | $2,953 | $37,240 | $7,450 | $29,790 |
| 2016 | $2,579 | $30,790 | $7,450 | $23,340 |
| 2015 | $2,439 | $30,790 | $7,450 | $23,340 |
| 2014 | $2,439 | $30,790 | $7,450 | $23,340 |
| 2012 | -- | $40,460 | $7,480 | $32,980 |
Source: Public Records
Map
Nearby Homes
- 1029 Tudor Rd
- 835 Greenmount Blvd
- 740 Greenmount Blvd
- 613 Gainsborough Rd
- 936 Westminster Place
- 922 Broadmoor Dr
- 2251 Broadmoor Dr
- 724 Patterson Rd
- 1622 Shroyer Rd
- 430 Forrer Blvd
- 2286 Yorkshire Place
- 651 Wiltshire Blvd
- 726 Acorn Dr
- 1809 Shroyer Rd
- 538 Wiltshire Blvd
- 456 Roy Ave
- 1051 Patterson Rd
- 1916 Shroyer Rd
- 557 Shroyer Rd
- 1065 Patterson Rd
- 1009 Tudor Rd
- 1017 Tudor Rd
- 1005 Tudor Rd
- 1021 Tudor Rd
- 1008 Warwick Place
- 1012 Warwick Place
- 1004 Warwick Place
- 1025 Tudor Rd
- 840 Gainsborough Rd
- 1016 Warwick Place
- 1014 Tudor Rd
- 1000 Warwick Place
- 1016 Tudor Rd
- 1020 Warwick Place
- 1010 Tudor Rd
- 1020 Tudor Rd
- 1006 Tudor Rd
- 1024 Warwick Place
- 904 Gainsborough Rd
- 1033 Tudor Rd