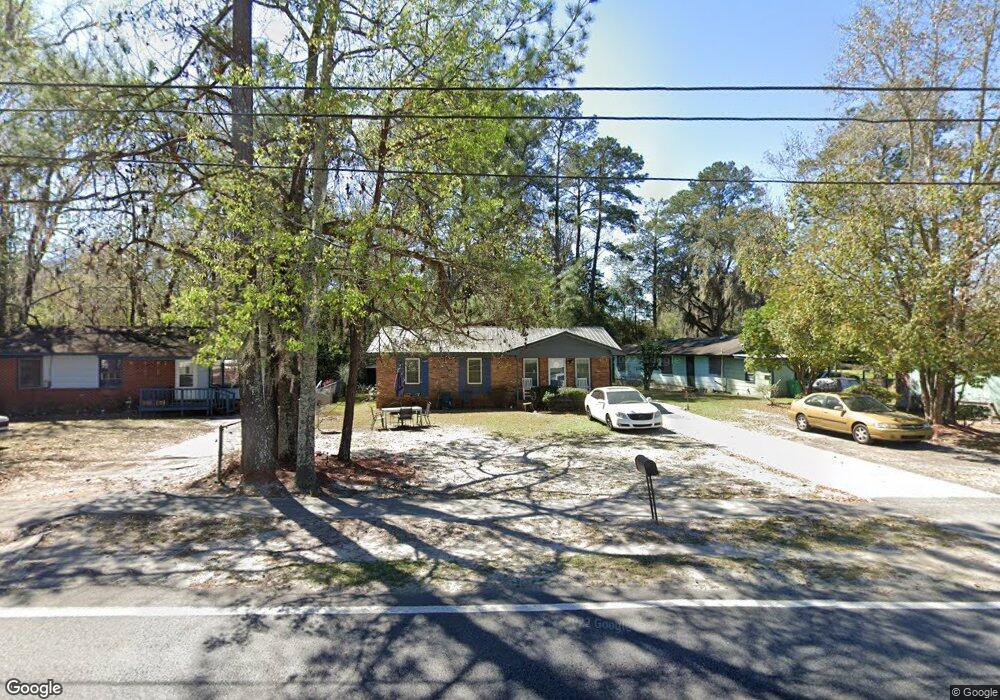
1013 W Gordon St Valdosta, GA 31601
Estimated Value: $117,333 - $148,000
4
Beds
2
Baths
1,605
Sq Ft
$80/Sq Ft
Est. Value
About This Home
This home is located at 1013 W Gordon St, Valdosta, GA 31601 and is currently estimated at $129,083, approximately $80 per square foot. 1013 W Gordon St is a home located in Lowndes County with nearby schools including S.L. Mason Elementary School, Valdosta Middle School, and Valdosta High School.
Ownership History
Date
Name
Owned For
Owner Type
Purchase Details
Closed on
Oct 23, 2007
Sold by
Stewart David E
Bought by
Stewart David E and Stewart Ernestine
Current Estimated Value
Purchase Details
Closed on
Oct 15, 2007
Sold by
Stewart Ernestine
Bought by
Stewart David E
Purchase Details
Closed on
May 13, 1991
Bought by
Roberts Ernestine Etal
Purchase Details
Closed on
Apr 2, 1991
Bought by
Roberts Ernestine
Purchase Details
Closed on
Dec 20, 1989
Bought by
Tindall Otis E
Purchase Details
Closed on
Aug 21, 1980
Bought by
Tindall Otis E
Purchase Details
Closed on
Apr 7, 1977
Bought by
Lindsey Lester E Etal
Purchase Details
Closed on
Aug 5, 1975
Bought by
Secretary Of Housing
Purchase Details
Closed on
Jan 23, 1974
Bought by
Tanner Maggie J
Purchase Details
Closed on
Mar 28, 1972
Bought by
Master Builders Enterpri
Purchase Details
Closed on
Dec 31, 1971
Bought by
Master Builders Enterpri
Create a Home Valuation Report for This Property
The Home Valuation Report is an in-depth analysis detailing your home's value as well as a comparison with similar homes in the area
Home Values in the Area
Average Home Value in this Area
Purchase History
| Date | Buyer | Sale Price | Title Company |
|---|---|---|---|
| Stewart David E | -- | -- | |
| Stewart David E | -- | -- | |
| Roberts Ernestine Etal | -- | -- | |
| Roberts Ernestine | -- | -- | |
| Roberts Ernestine | $19,000 | -- | |
| Tindall Otis E | -- | -- | |
| Tindall Otis E | $1,000 | -- | |
| Lindsey Lester E Etal | -- | -- | |
| Secretary Of Housing | -- | -- | |
| Tanner Maggie J | $18,000 | -- | |
| Master Builders Enterpri | -- | -- | |
| Master Builders Enterpri | $5,000 | -- |
Source: Public Records
Tax History Compared to Growth
Tax History
| Year | Tax Paid | Tax Assessment Tax Assessment Total Assessment is a certain percentage of the fair market value that is determined by local assessors to be the total taxable value of land and additions on the property. | Land | Improvement |
|---|---|---|---|---|
| 2024 | $685 | $30,517 | $1,333 | $29,184 |
| 2023 | $685 | $27,085 | $1,333 | $25,752 |
| 2022 | $438 | $18,957 | $1,333 | $17,624 |
| 2021 | $451 | $18,957 | $1,333 | $17,624 |
| 2020 | $460 | $18,957 | $1,333 | $17,624 |
| 2019 | $460 | $18,957 | $1,333 | $17,624 |
| 2018 | $466 | $18,957 | $1,333 | $17,624 |
| 2017 | $469 | $18,957 | $1,333 | $17,624 |
| 2016 | $539 | $20,907 | $1,333 | $19,574 |
| 2015 | $495 | $20,907 | $1,333 | $19,574 |
| 2014 | $503 | $20,907 | $1,333 | $19,574 |
Source: Public Records
Map
Nearby Homes
- 1202 Melissa Dr
- 820 W Gordon St
- 1197 Jo Ree St
- 503 Roberts St
- 1400 Lankford Dr
- 1522 Woodard St
- 614 Lamar St
- 1114 Clark St
- 316 Blitch St
- 808 W Adair St
- TBD Moss Oak Dr
- * Sustella - Green Unit 3
- 724 J L Lomax Dr
- 1911 Baytree Place
- 704 3rd Ave
- 1811 Canterbury Dr
- 410 W Adair St
- 605 N Saint Augustine Rd
- 0 Canal St
- 1501 Harmon Dr
- 1011 W Gordon St
- 909 Hightower St
- 900 Greenwood Dr
- 3211 Rhett Rd
- 908 Hightower St
- 902 Greenwood Dr
- 1015 W Gordon St
- 1015 W Gordon St Unit 1
- 1031 W Gordon St
- 1008 Hillside Dr
- 909 Greenwood Dr Unit 1-8
- 1009 Hillside Dr
- 1017 W Gordon St
- 904 Hendry Dr
- 816 W Gordon St
- 905 Greenwood Dr
- 906 Hendry Dr
- 1010 Hillside Dr
- 1016 W Gordon St
- 903 Greenwood Dr