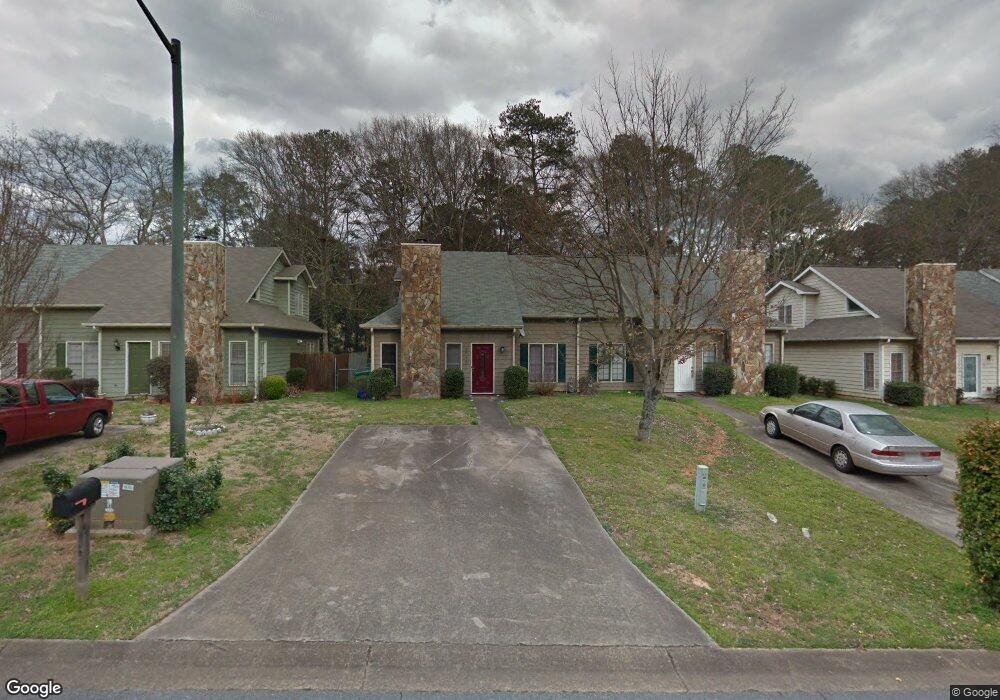
1013 Whitfield Ct SE Smyrna, GA 30080
Estimated Value: $266,434 - $331,000
2
Beds
2
Baths
1,391
Sq Ft
$214/Sq Ft
Est. Value
About This Home
This home is located at 1013 Whitfield Ct SE, Smyrna, GA 30080 and is currently estimated at $297,109, approximately $213 per square foot. 1013 Whitfield Ct SE is a home located in Cobb County with nearby schools including Smyrna Elementary School, Campbell Middle School, and Campbell High School.
Ownership History
Date
Name
Owned For
Owner Type
Purchase Details
Closed on
Sep 16, 2005
Sold by
Mcintosh Donald J and Mcintosh Deborah
Bought by
Green Lanita S
Current Estimated Value
Home Financials for this Owner
Home Financials are based on the most recent Mortgage that was taken out on this home.
Original Mortgage
$100,965
Outstanding Balance
$53,413
Interest Rate
5.77%
Mortgage Type
VA
Estimated Equity
$243,696
Purchase Details
Closed on
Feb 20, 2003
Sold by
Mcintosh Donald J
Bought by
Mcintosh Donald J and Mcintosh Deborah A
Home Financials for this Owner
Home Financials are based on the most recent Mortgage that was taken out on this home.
Original Mortgage
$72,100
Interest Rate
5.89%
Mortgage Type
New Conventional
Purchase Details
Closed on
Jun 27, 1997
Sold by
Orwig Gwen
Bought by
Mcintosh Donald J
Home Financials for this Owner
Home Financials are based on the most recent Mortgage that was taken out on this home.
Original Mortgage
$78,500
Interest Rate
7.87%
Mortgage Type
FHA
Create a Home Valuation Report for This Property
The Home Valuation Report is an in-depth analysis detailing your home's value as well as a comparison with similar homes in the area
Home Values in the Area
Average Home Value in this Area
Purchase History
| Date | Buyer | Sale Price | Title Company |
|---|---|---|---|
| Green Lanita S | $102,600 | -- | |
| Mcintosh Donald J | -- | -- | |
| Mcintosh Donald J | $80,000 | -- |
Source: Public Records
Mortgage History
| Date | Status | Borrower | Loan Amount |
|---|---|---|---|
| Open | Green Lanita S | $100,965 | |
| Previous Owner | Mcintosh Donald J | $72,100 | |
| Previous Owner | Mcintosh Donald J | $78,500 |
Source: Public Records
Tax History Compared to Growth
Tax History
| Year | Tax Paid | Tax Assessment Tax Assessment Total Assessment is a certain percentage of the fair market value that is determined by local assessors to be the total taxable value of land and additions on the property. | Land | Improvement |
|---|---|---|---|---|
| 2025 | $1,822 | $93,140 | $30,000 | $63,140 |
| 2024 | $1,889 | $96,720 | $18,000 | $78,720 |
| 2023 | $1,400 | $96,720 | $18,000 | $78,720 |
| 2022 | $1,907 | $96,720 | $18,000 | $78,720 |
| 2021 | $1,339 | $66,220 | $12,000 | $54,220 |
| 2020 | $1,339 | $66,220 | $12,000 | $54,220 |
| 2019 | $1,037 | $50,340 | $12,000 | $38,340 |
| 2018 | $1,037 | $50,340 | $12,000 | $38,340 |
| 2017 | $983 | $50,340 | $12,000 | $38,340 |
| 2016 | $985 | $50,340 | $12,000 | $38,340 |
| 2015 | $217 | $18,064 | $2,000 | $16,064 |
| 2014 | $219 | $18,064 | $0 | $0 |
Source: Public Records
Map
Nearby Homes
- 1764 Whitfield Parc Cir
- 1579 Walker St SE
- 1761 Whitfield Parc Cir SE
- 2781 Mathews St SE
- 1417 Springleaf Cir SE
- 1700 Wynndowne Trail SE Unit C
- 1537 Springleaf Cove SE
- 2964 Anderson Cir SE
- 1722 Wynndowne Trail SE
- 1768 Evenstad Way
- 3037 Ferrington Way
- 2861 Bernard Ln SE
- 2791 Madison St SE
- 2654 Davenport St SE
- 2683 Davenport St SE
- 1461 Hawthorne Ave SE
- 3001 Hawthorne Place SE
- 1015 Whitfield Ct SE
- 1003 Whitfield Ct SE
- 1001 Whitfield Ct SE
- 1027 Whitfield Ct SE
- 1010 Whitfield Ct SE
- 2000 Whitfield St SE Unit 2
- 1020 Whitfield Ct SE
- 1037 Whitfield Ct SE
- 1562 Whitfield St SE
- 1026 Whitfield Ct SE
- 1040 Mathews Ct SE
- 1030 Whitfield Ct SE
- 1729 Whitfield St SE
- 1733 Whitfield St SE
- 1569 Whitfield St
- 1749 Whitfield St SE
- 1565 Whitfield St SE
- 1561 Whitfield St SE
- 1049 Whitfield Ct SE
- 1550 Whitfield St SE