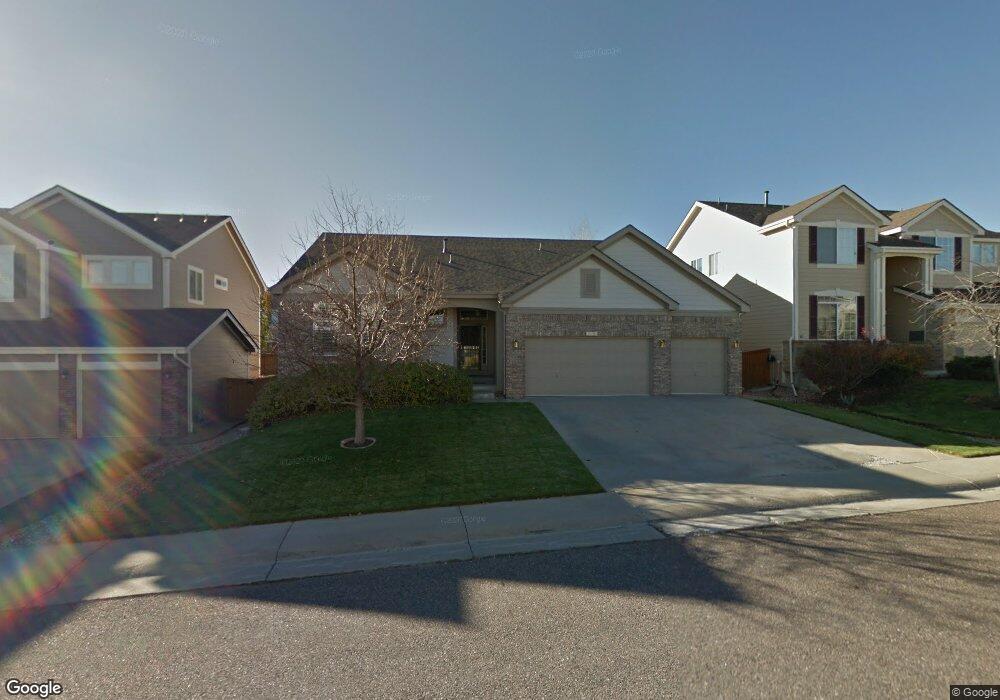
10135 Nickolas Ave Highlands Ranch, CO 80130
Southridge NeighborhoodEstimated Value: $711,000 - $792,000
3
Beds
2
Baths
2,134
Sq Ft
$354/Sq Ft
Est. Value
About This Home
This home is located at 10135 Nickolas Ave, Highlands Ranch, CO 80130 and is currently estimated at $756,475, approximately $354 per square foot. 10135 Nickolas Ave is a home located in Douglas County with nearby schools including Redstone Elementary School, Rocky Heights Middle School, and Rock Canyon High School.
Ownership History
Date
Name
Owned For
Owner Type
Purchase Details
Closed on
Dec 19, 2025
Sold by
Ratzlaff Lowell David
Bought by
Lowell David Ratzlaff Trust
Current Estimated Value
Purchase Details
Closed on
Aug 1, 2001
Sold by
Philip M Walker Family Trust
Bought by
Ratzlaff Lowell David and Ratzlaff Marlene Mae
Home Financials for this Owner
Home Financials are based on the most recent Mortgage that was taken out on this home.
Original Mortgage
$242,000
Interest Rate
7.11%
Purchase Details
Closed on
May 20, 1999
Sold by
Walker Philip M and Walker Marjorie A
Bought by
The Philip M Walker Family Trust
Home Financials for this Owner
Home Financials are based on the most recent Mortgage that was taken out on this home.
Original Mortgage
$65,000
Interest Rate
6.94%
Purchase Details
Closed on
Dec 15, 1998
Sold by
Shea Homes
Bought by
Ryland Group Inc
Purchase Details
Closed on
Oct 1, 1997
Sold by
Mission Viejo Co
Bought by
Shea Homes
Create a Home Valuation Report for This Property
The Home Valuation Report is an in-depth analysis detailing your home's value as well as a comparison with similar homes in the area
Home Values in the Area
Average Home Value in this Area
Purchase History
| Date | Buyer | Sale Price | Title Company |
|---|---|---|---|
| Lowell David Ratzlaff Trust | -- | None Listed On Document | |
| Ratzlaff Lowell David | $302,500 | -- | |
| The Philip M Walker Family Trust | -- | -- | |
| Walker Philip M | $260,815 | Cornerstone Title Co | |
| Ryland Group Inc | $313,700 | -- | |
| Shea Homes | -- | -- |
Source: Public Records
Mortgage History
| Date | Status | Borrower | Loan Amount |
|---|---|---|---|
| Previous Owner | Ratzlaff Lowell David | $242,000 | |
| Previous Owner | Walker Philip M | $65,000 | |
| Closed | Walker Philip M | $80,000 |
Source: Public Records
Tax History
| Year | Tax Paid | Tax Assessment Tax Assessment Total Assessment is a certain percentage of the fair market value that is determined by local assessors to be the total taxable value of land and additions on the property. | Land | Improvement |
|---|---|---|---|---|
| 2025 | $4,414 | $49,930 | $10,590 | $39,340 |
| 2024 | $4,414 | $57,210 | $12,260 | $44,950 |
| 2023 | $4,406 | $57,210 | $12,260 | $44,950 |
| 2022 | $3,140 | $41,320 | $8,930 | $32,390 |
| 2021 | $3,267 | $41,320 | $8,930 | $32,390 |
| 2020 | $2,934 | $38,780 | $8,120 | $30,660 |
| 2019 | $2,944 | $38,780 | $8,120 | $30,660 |
| 2018 | $2,804 | $36,870 | $7,730 | $29,140 |
| 2017 | $2,553 | $36,870 | $7,730 | $29,140 |
| 2016 | $2,399 | $35,320 | $7,450 | $27,870 |
| 2015 | $1,225 | $35,320 | $7,450 | $27,870 |
| 2014 | $1,114 | $30,940 | $7,320 | $23,620 |
Source: Public Records
Map
Nearby Homes
- 10102 Glenstone Cir
- 10155 Joseph Dr
- 10232 Nickolas Ave
- 10060 Matthew Ln
- 10292 Nickolas Ave
- 10439 Cheetah Winds
- 9845 Keenan St
- 10445 Cheetah Winds
- 10146 Jill Ave
- 10098 Mackay Dr
- 10330 Lions Path
- 10499 Cheetah Winds
- 9891 Atherton Way
- 5639 Jaguar Way
- 10269 Fawnbrook Ct
- 9836 Bathurst Way
- 9805 Sydney Ln
- 10541 Jaguar Glen
- 5156 Sydney Ave
- 9712 Queenscliffe Dr
- 10141 Nickolas Ave
- 10129 Nickolas Ave
- 10120 Glenstone Cir
- 10123 Nickolas Ave
- 10147 Nickolas Ave
- 10126 Glenstone Cir
- 10114 Glenstone Cir
- 10138 Nickolas Ave
- 10130 Glenstone Cir
- 10126 Nickolas Ave
- 10144 Nickolas Ave
- 10153 Nickolas Ave
- 10117 Nickolas Ave
- 10110 Glenstone Cir
- 10134 Glenstone Cir
- 10150 Nickolas Ave
- 10120 Nickolas Ave
- 10111 Nickolas Ave
- 10159 Nickolas Ave
- 10114 Nickolas Ave
Your Personal Tour Guide
Ask me questions while you tour the home.