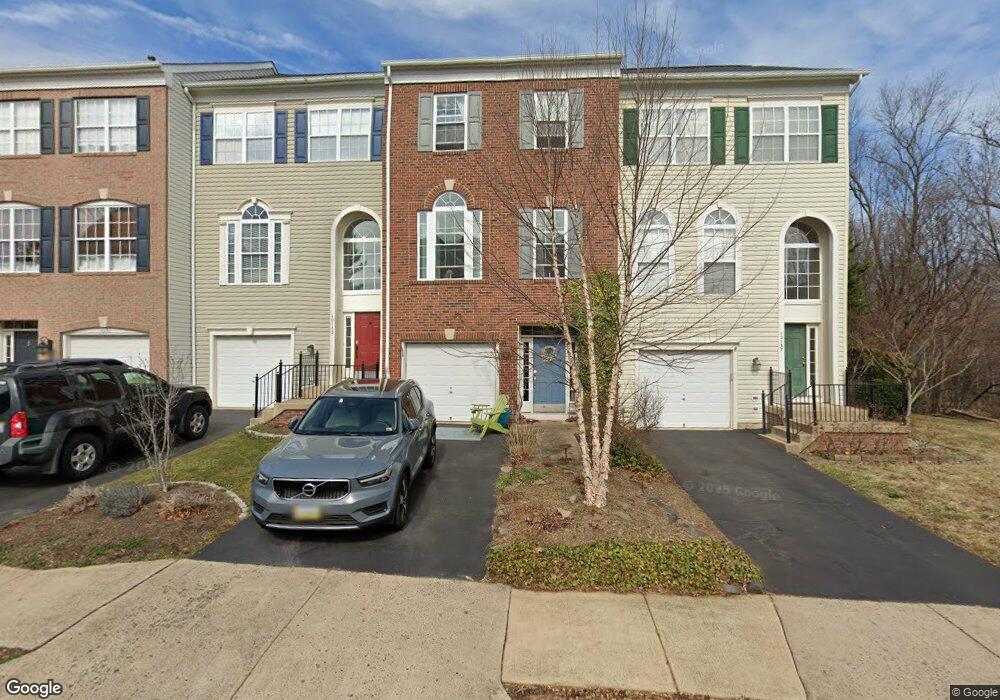
10135 Pale Rose Loop Bristow, VA 20136
Braemar NeighborhoodEstimated Value: $465,055 - $555,000
3
Beds
2
Baths
1,440
Sq Ft
$361/Sq Ft
Est. Value
About This Home
This home is located at 10135 Pale Rose Loop, Bristow, VA 20136 and is currently estimated at $520,514, approximately $361 per square foot. 10135 Pale Rose Loop is a home located in Prince William County with nearby schools including Patriot High School, Cedar Point Elementary School, and E.H. Marsteller Middle School.
Ownership History
Date
Name
Owned For
Owner Type
Purchase Details
Closed on
Apr 8, 2011
Sold by
Daigrepont Teska and Daigrepont Jessica S
Bought by
Daigrepont Jessica S
Current Estimated Value
Purchase Details
Closed on
May 6, 2004
Sold by
Stookey Jason L
Bought by
Whitmoyer Jessica S and Whitmoyer Grepont,Teska
Home Financials for this Owner
Home Financials are based on the most recent Mortgage that was taken out on this home.
Original Mortgage
$233,840
Outstanding Balance
$108,789
Interest Rate
5.39%
Mortgage Type
New Conventional
Estimated Equity
$411,725
Purchase Details
Closed on
Mar 31, 2000
Sold by
Coscan Washington Inc
Bought by
Stookey Jason L
Home Financials for this Owner
Home Financials are based on the most recent Mortgage that was taken out on this home.
Original Mortgage
$156,250
Interest Rate
8.4%
Create a Home Valuation Report for This Property
The Home Valuation Report is an in-depth analysis detailing your home's value as well as a comparison with similar homes in the area
Home Values in the Area
Average Home Value in this Area
Purchase History
| Date | Buyer | Sale Price | Title Company |
|---|---|---|---|
| Daigrepont Jessica S | -- | First Guardian Title & Escro | |
| Whitmoyer Jessica S | $292,300 | -- | |
| Stookey Jason L | $157,040 | -- |
Source: Public Records
Mortgage History
| Date | Status | Borrower | Loan Amount |
|---|---|---|---|
| Open | Whitmoyer Jessica S | $233,840 | |
| Previous Owner | Stookey Jason L | $156,250 |
Source: Public Records
Tax History Compared to Growth
Tax History
| Year | Tax Paid | Tax Assessment Tax Assessment Total Assessment is a certain percentage of the fair market value that is determined by local assessors to be the total taxable value of land and additions on the property. | Land | Improvement |
|---|---|---|---|---|
| 2025 | $4,256 | $464,800 | $136,500 | $328,300 |
| 2024 | $4,256 | $428,000 | $130,000 | $298,000 |
| 2023 | $4,250 | $408,500 | $115,300 | $293,200 |
| 2022 | $4,363 | $385,300 | $115,300 | $270,000 |
| 2021 | $4,121 | $336,400 | $94,800 | $241,600 |
| 2020 | $4,841 | $312,300 | $85,400 | $226,900 |
| 2019 | $4,740 | $305,800 | $79,700 | $226,100 |
| 2018 | $3,478 | $288,000 | $79,700 | $208,300 |
| 2017 | $3,532 | $285,000 | $79,700 | $205,300 |
| 2016 | $3,317 | $269,800 | $75,000 | $194,800 |
| 2015 | $3,219 | $262,100 | $75,000 | $187,100 |
| 2014 | $3,219 | $256,100 | $72,100 | $184,000 |
Source: Public Records
Map
Nearby Homes
- 12127 & 12131 Vint Hill Rd
- Hampton II Plan at Parkgate Estates
- 10028 Boreland Ct
- 12750 Brewland Way
- 12151 Hayfield Ct
- 10045 Pentland Hills Way
- 12021 Spring Beauty Rd
- 12048 Elliots Oak Place
- 10512 Blazing Star Loop
- 12054 Nokesville Rd
- 9656 Bedder Stone Place
- 9579 Scales Place
- 9475 Sarah Mill Terrace
- 9478 Merrimont Trace Cir
- 10554 Andrew Humphreys Ct
- 9293 Crestview Ridge Dr
- 9758 Tombreck Ct
- 9318 Crestview Ridge Dr
- 9244 Crestview Ridge Dr
- 9381 Crestview Ridge Dr
- 10133 Pale Rose Loop
- 10137 Pale Rose Loop
- 10131 Pale Rose Loop
- 10127 Pale Rose Loop
- 10141 Pale Rose Loop
- 10125 Pale Rose Loop
- 10143 Pale Rose Loop
- 10136 Pale Rose Loop
- 10134 Pale Rose Loop
- 10139 Pale Rose Loop
- 10138 Pale Rose Loop
- 10132 Pale Rose Loop
- 10123 Pale Rose Loop
- 10123 Pale Rose Loop Unit 3/27/2010
- 10145 Pale Rose Loop
- 10147 Pale Rose Loop
- 10120 Pale Rose Loop
- 12467 Iona Sound Dr
- 10118 Pale Rose Loop
- 10151 Pale Rose Loop