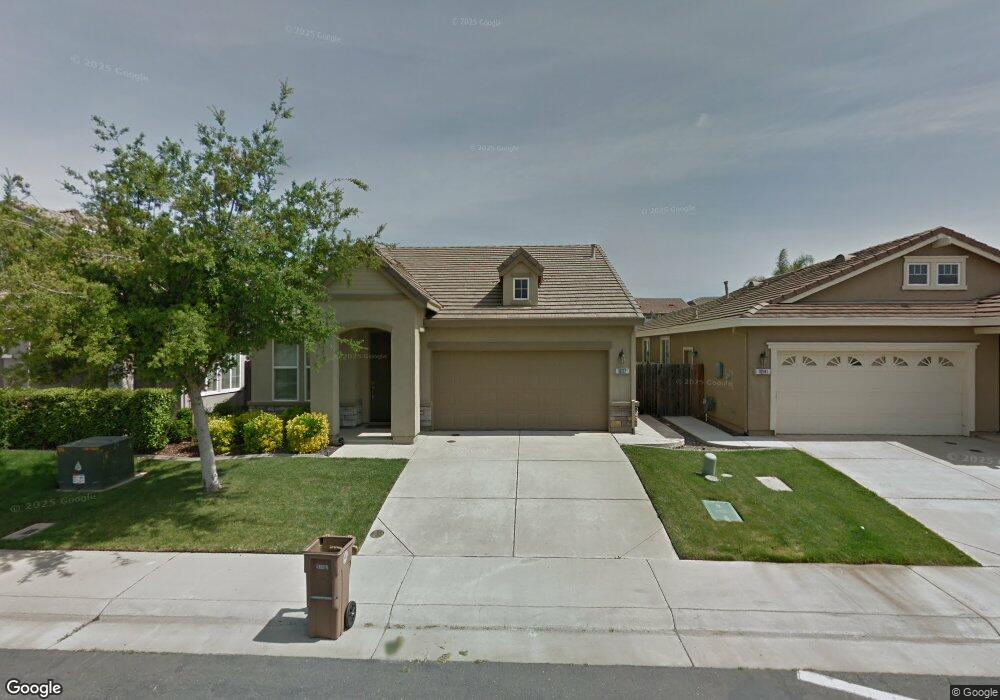
10137 Lofton Way Elk Grove, CA 95757
South West Elk Grove NeighborhoodEstimated Value: $425,000 - $572,000
3
Beds
2
Baths
1,540
Sq Ft
$341/Sq Ft
Est. Value
About This Home
This home is located at 10137 Lofton Way, Elk Grove, CA 95757 and is currently estimated at $525,301, approximately $341 per square foot. 10137 Lofton Way is a home located in Sacramento County with nearby schools including Franklin Elementary School, Toby Johnson Middle School, and Franklin High School.
Ownership History
Date
Name
Owned For
Owner Type
Purchase Details
Closed on
Apr 14, 2021
Sold by
Edward Robinson Lawrence
Bought by
Lawrence Edward Robinson Jr Living Trust
Current Estimated Value
Home Financials for this Owner
Home Financials are based on the most recent Mortgage that was taken out on this home.
Original Mortgage
$212,000
Outstanding Balance
$191,410
Interest Rate
3%
Mortgage Type
New Conventional
Estimated Equity
$333,891
Purchase Details
Closed on
Oct 30, 2020
Sold by
Robinson Lawrence E
Bought by
Robinson Lawrence E and Lawrence Edward Robinson
Purchase Details
Closed on
Jul 20, 2004
Sold by
Beazer Homes Holdings Corp
Bought by
Robinson Lawrence E
Home Financials for this Owner
Home Financials are based on the most recent Mortgage that was taken out on this home.
Original Mortgage
$237,000
Interest Rate
5.87%
Mortgage Type
Purchase Money Mortgage
Create a Home Valuation Report for This Property
The Home Valuation Report is an in-depth analysis detailing your home's value as well as a comparison with similar homes in the area
Home Values in the Area
Average Home Value in this Area
Purchase History
| Date | Buyer | Sale Price | Title Company |
|---|---|---|---|
| Lawrence Edward Robinson Jr Living Trust | -- | Fidelity National Title | |
| Robinson Lawrence E | -- | None Available | |
| Robinson Lawrence E | $296,500 | Chicago Title Co |
Source: Public Records
Mortgage History
| Date | Status | Borrower | Loan Amount |
|---|---|---|---|
| Open | Lawrence Edward Robinson Jr Living Trust | $212,000 | |
| Previous Owner | Robinson Lawrence E | $237,000 | |
| Closed | Robinson Lawrence E | $44,400 |
Source: Public Records
Tax History Compared to Growth
Tax History
| Year | Tax Paid | Tax Assessment Tax Assessment Total Assessment is a certain percentage of the fair market value that is determined by local assessors to be the total taxable value of land and additions on the property. | Land | Improvement |
|---|---|---|---|---|
| 2025 | $6,376 | $413,277 | $125,443 | $287,834 |
| 2024 | $6,376 | $405,175 | $122,984 | $282,191 |
| 2023 | $6,231 | $397,231 | $120,573 | $276,658 |
| 2022 | $6,132 | $389,443 | $118,209 | $271,234 |
| 2021 | $6,020 | $381,808 | $115,892 | $265,916 |
| 2020 | $5,836 | $361,142 | $109,620 | $251,522 |
| 2019 | $5,630 | $343,945 | $104,400 | $239,545 |
| 2018 | $5,475 | $333,928 | $101,360 | $232,568 |
| 2017 | $5,193 | $309,193 | $93,852 | $215,341 |
| 2016 | $4,952 | $297,302 | $90,243 | $207,059 |
| 2015 | $6,268 | $275,281 | $83,559 | $191,722 |
| 2014 | $5,602 | $267,263 | $81,125 | $186,138 |
Source: Public Records
Map
Nearby Homes
- 5900 Mclean Dr
- 10125 Brian Kelly Way
- 10141 Brian Kelly Way
- 10169 Brenna Way
- 5212 Namath Cir
- 5330 Coconut Tree Ct
- 10240 Jenny Lynn Way
- 10292 Marlaw Way
- 10230 Patti Way
- 10272 Beckley Way
- 6534 Oscar Cir
- 10332 Danichris Way
- 10149 van Brocklin Way
- 4908 Hutson Way
- 10372 Christo Way
- 6829 Salvaterra Cir
- 6028 Travo Way
- 10065 Waterfield Dr
- 9987 Spring View Way
- 10250 Stockmen Way
- 10141 Lofton Way
- 10133 Lofton Way
- 10145 Lofton Way
- 10129 Lofton Way
- 10114 Clairina Way
- 10118 Clairina Way
- 10110 Clairina Way
- 10125 Lofton Way
- 10149 Lofton Way
- 10122 Clairina Way
- 10136 Lofton Way
- 10140 Lofton Way
- 10132 Lofton Way
- 10106 Clairina Way
- 10144 Lofton Way
- 10128 Lofton Way
- 10126 Clairina Way
- 10121 Lofton Way
- 10148 Lofton Way
- 10124 Lofton Way