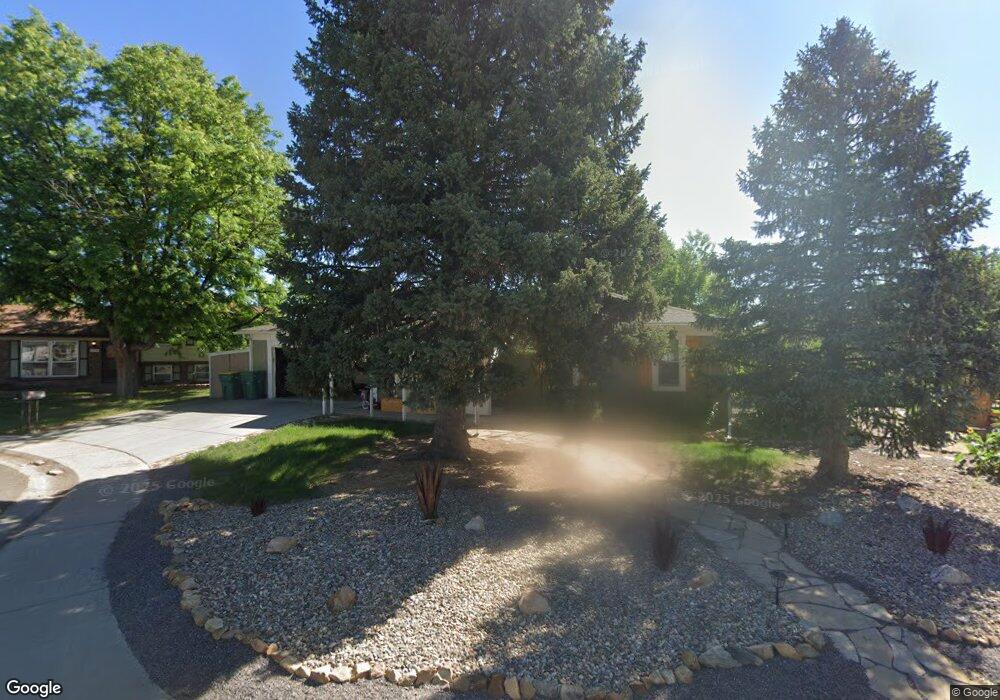
10139 W Lambuth Ave Denver, CO 80235
Friendly Hills NeighborhoodEstimated Value: $537,000 - $581,000
3
Beds
3
Baths
1,862
Sq Ft
$302/Sq Ft
Est. Value
About This Home
This home is located at 10139 W Lambuth Ave, Denver, CO 80235 and is currently estimated at $561,809, approximately $301 per square foot. 10139 W Lambuth Ave is a home located in Jefferson County with nearby schools including Bear Creek K-8 School, Carmody Middle School, and Bear Creek High School.
Ownership History
Date
Name
Owned For
Owner Type
Purchase Details
Closed on
Aug 27, 2015
Sold by
Stephens Jason and Brown Amy
Bought by
Vamosy Brian and Ortiz Marisol
Current Estimated Value
Home Financials for this Owner
Home Financials are based on the most recent Mortgage that was taken out on this home.
Original Mortgage
$264,000
Outstanding Balance
$106,584
Interest Rate
4.12%
Mortgage Type
New Conventional
Estimated Equity
$455,225
Purchase Details
Closed on
Jun 7, 2013
Sold by
Jakuba Pavol Christopher
Bought by
Stephens Jason and Brown Amy
Purchase Details
Closed on
Oct 12, 2011
Sold by
Federal National Mortgage Association
Bought by
Jakuba Pavol Christopher
Purchase Details
Closed on
Sep 2, 2011
Sold by
Olguin Thomas J
Bought by
Wells Fargo Bank Na
Purchase Details
Closed on
Sep 1, 2011
Sold by
Wells Fargo Bank Na
Bought by
Federal National Mortgage Association
Create a Home Valuation Report for This Property
The Home Valuation Report is an in-depth analysis detailing your home's value as well as a comparison with similar homes in the area
Home Values in the Area
Average Home Value in this Area
Purchase History
| Date | Buyer | Sale Price | Title Company |
|---|---|---|---|
| Vamosy Brian | $330,000 | North American Title | |
| Stephens Jason | $244,900 | Chicago Title Co | |
| Jakuba Pavol Christopher | $105,000 | None Available | |
| Wells Fargo Bank Na | -- | None Available | |
| Federal National Mortgage Association | -- | None Available |
Source: Public Records
Mortgage History
| Date | Status | Borrower | Loan Amount |
|---|---|---|---|
| Open | Vamosy Brian | $264,000 |
Source: Public Records
Tax History Compared to Growth
Tax History
| Year | Tax Paid | Tax Assessment Tax Assessment Total Assessment is a certain percentage of the fair market value that is determined by local assessors to be the total taxable value of land and additions on the property. | Land | Improvement |
|---|---|---|---|---|
| 2024 | $3,155 | $32,210 | $10,889 | $21,321 |
| 2023 | $3,155 | $32,210 | $10,889 | $21,321 |
| 2022 | $2,730 | $27,363 | $8,891 | $18,472 |
| 2021 | $2,764 | $28,150 | $9,147 | $19,003 |
| 2020 | $2,435 | $24,851 | $6,993 | $17,858 |
| 2019 | $2,405 | $24,851 | $6,993 | $17,858 |
| 2018 | $2,186 | $21,820 | $7,157 | $14,663 |
| 2017 | $1,996 | $21,820 | $7,157 | $14,663 |
| 2016 | $1,773 | $18,712 | $5,506 | $13,206 |
| 2015 | $1,591 | $18,712 | $5,506 | $13,206 |
| 2014 | $1,591 | $15,741 | $5,672 | $10,069 |
Source: Public Records
Map
Nearby Homes
- 10362 W Lehigh Ave
- 10441 W Lehigh Ave
- 10600 W Girard Ave
- 10351 W Girton Dr Unit 2
- 10467 W Hampden Ave Unit 204
- 3353 S Newcombe St
- 9862 W Rice Ave
- 2501 S Kipling St
- 3343 S Newcombe St
- 3317 S Nelson St
- 4339 S Independence Ct
- 4415 S Johnson Ct
- 3299 S Newcombe St
- 3354 S Flower St Unit 85
- 3354 S Flower St Unit 52
- 10561 W Dartmouth Ave
- 3355 S Flower St Unit 106
- 3355 S Flower St Unit 74
- 3355 S Flower St Unit 166
- 8800 W Jefferson Ave
- 10119 W Lambuth Ave
- 10159 W Lambuth Ave
- 10099 W Lambuth Ave
- 10150 W Lambuth Ave
- 10138 W Kenyon Ave
- 10179 W Lambuth Ave
- 10140 W Lambuth Ave
- 10130 W Lambuth Ave
- 10158 W Kenyon Ave
- 10120 W Lambuth Ave
- 10180 W Lambuth Ave
- 10160 W Lambuth Ave
- 10118 W Kenyon Ave
- 10079 W Lambuth Ave
- 10100 W Lambuth Ave
- 10221 W Lehigh Ave
- 10201 W Lehigh Ave
- 3772 S Lee Ct
- 3762 S Lee Ct
- 10177 W Kenyon Ave