Estimated Value: $618,000 - $1,027,000
5
Beds
4
Baths
3,904
Sq Ft
$231/Sq Ft
Est. Value
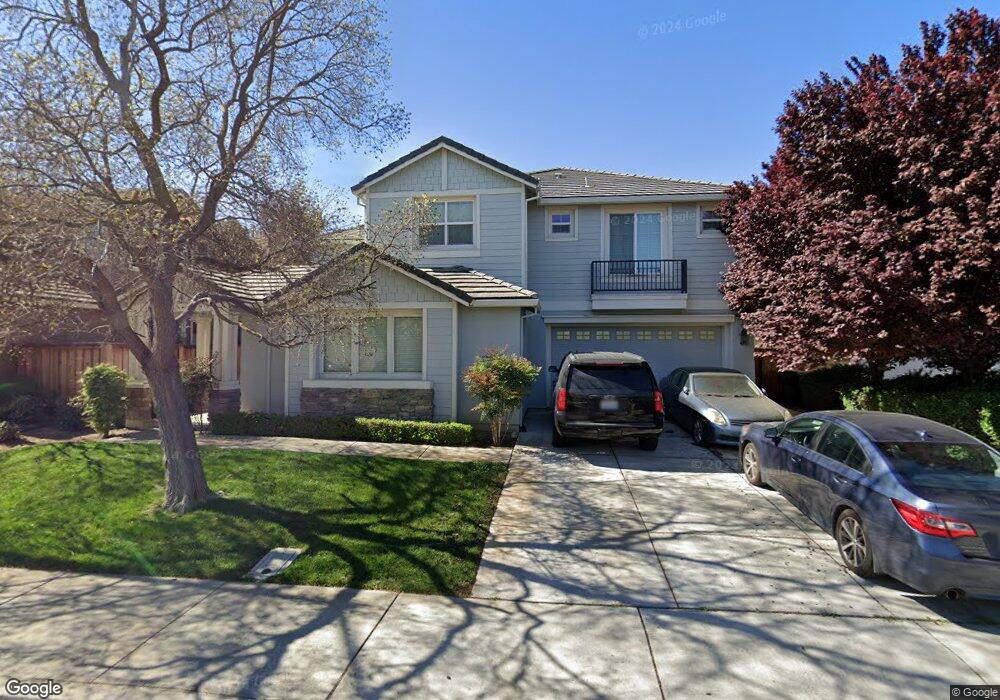
About This Home
This home is located at 1014 Bear Place, Tracy, CA 95304 and is currently estimated at $901,898, approximately $231 per square foot. 1014 Bear Place is a home located in San Joaquin County with nearby schools including Louis A. Bohn Elementary School, Earle E. Williams Middle School, and Tracy High School.
Ownership History
Date
Name
Owned For
Owner Type
Purchase Details
Closed on
Nov 28, 2011
Sold by
Clanton Christopher Dale
Bought by
Clanton Leilani
Current Estimated Value
Home Financials for this Owner
Home Financials are based on the most recent Mortgage that was taken out on this home.
Original Mortgage
$346,750
Outstanding Balance
$237,769
Interest Rate
4.06%
Mortgage Type
New Conventional
Estimated Equity
$664,129
Purchase Details
Closed on
Nov 21, 2003
Sold by
Pulte Home Corp
Bought by
Cruz Daniel A and Rivas Cruz Elisa D
Home Financials for this Owner
Home Financials are based on the most recent Mortgage that was taken out on this home.
Original Mortgage
$450,000
Interest Rate
4.75%
Mortgage Type
Purchase Money Mortgage
Create a Home Valuation Report for This Property
The Home Valuation Report is an in-depth analysis detailing your home's value as well as a comparison with similar homes in the area
Home Values in the Area
Average Home Value in this Area
Purchase History
| Date | Buyer | Sale Price | Title Company |
|---|---|---|---|
| Clanton Leilani | -- | North American Title Co Inc | |
| Clanton Leilani | $365,000 | North American Title Company | |
| Cruz Daniel A | $590,818 | First Amer Title Co |
Source: Public Records
Mortgage History
| Date | Status | Borrower | Loan Amount |
|---|---|---|---|
| Open | Clanton Leilani | $346,750 | |
| Previous Owner | Cruz Daniel A | $450,000 | |
| Closed | Cruz Daniel A | $121,487 |
Source: Public Records
Tax History
| Year | Tax Paid | Tax Assessment Tax Assessment Total Assessment is a certain percentage of the fair market value that is determined by local assessors to be the total taxable value of land and additions on the property. | Land | Improvement |
|---|---|---|---|---|
| 2025 | $6,680 | $458,450 | $114,297 | $344,153 |
| 2024 | $6,225 | $449,461 | $112,056 | $337,405 |
| 2023 | $6,118 | $440,649 | $109,859 | $330,790 |
| 2022 | $6,264 | $432,009 | $107,705 | $324,304 |
| 2021 | $6,111 | $423,540 | $105,594 | $317,946 |
| 2020 | $5,984 | $419,198 | $104,512 | $314,686 |
| 2019 | $13,055 | $410,979 | $102,463 | $308,516 |
| 2018 | $5,857 | $402,921 | $100,454 | $302,467 |
| 2017 | $5,633 | $395,022 | $98,485 | $296,537 |
| 2016 | $5,661 | $387,276 | $96,554 | $290,722 |
| 2014 | $5,340 | $373,990 | $93,241 | $280,749 |
Source: Public Records
Map
Nearby Homes
- 2307 Lighthouse Cir
- 2686 Ozark Dr
- 8336 Park Place
- 1011 Tulloch Dr
- 1242 Tulloch Dr
- 8411 Rinauro Ct
- 1624 Badger Way
- 544 Glenbriar Cir
- 27000 S Hillview St
- 524 Glenbriar Cir
- 25820 S Macarthur Dr
- 482 Quail Run Cir
- 8485 Ranch Rd
- 426 Darlene Ln
- 2851 Pebblebrooke Ct
- 515 Peerless Way Unit 13
- 2861 Pebblebrooke Ct
- 1110 Amaretto Dr
- 443 Glenbriar Cir
- 166 Norman Ct
- 1024 Bear Place
- 1004 Bear Place
- 2500 Neptune Ct
- 2530 Neptune Ct
- 1034 Bear Place Unit 9
- 2410 Galway Ct
- 2560 Neptune Ct
- 1023 Bear Place
- 2439 Neptune Ct Unit 9
- 2459 Neptune Ct Unit 9
- 2400 Galway Ct
- 2479 Neptune Ct
- 2499 Neptune Ct Unit 9
- 2399 Galway Ct
- 2350 Galway Ct
- 2519 Neptune Ct Unit 9
- 980 Eastlake Cir
- 970 Eastlake Cir
- 990 Eastlake Cir
- 1000 Eastlake Cir
Your Personal Tour Guide
Ask me questions while you tour the home.