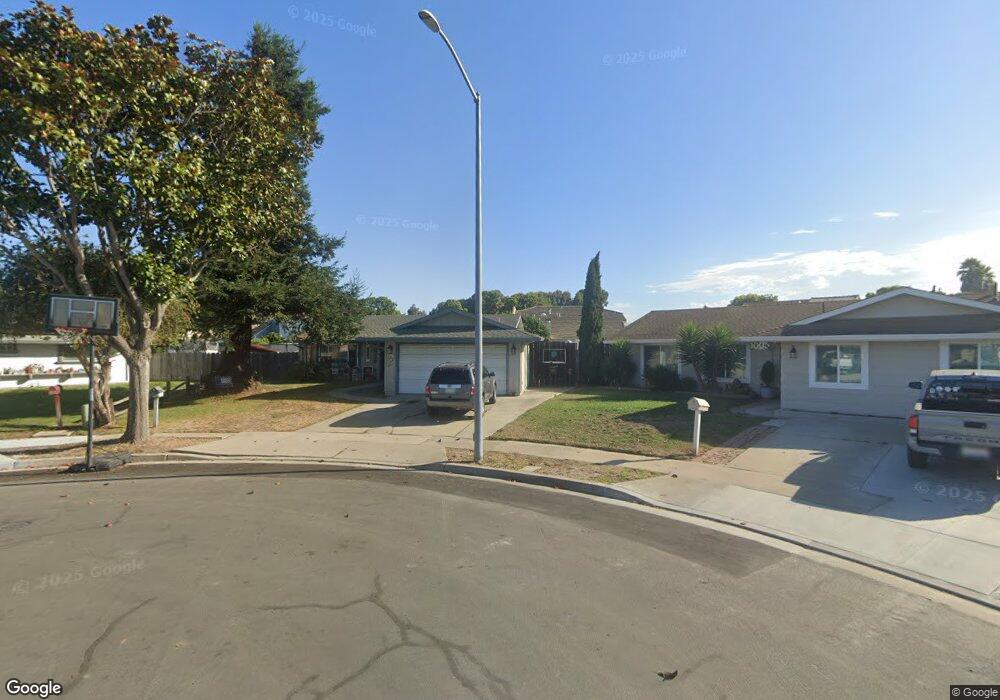
1014 Flint Cir Unit 3 Salinas, CA 93907
Boronda NeighborhoodEstimated Value: $563,000 - $656,352
3
Beds
2
Baths
1,110
Sq Ft
$568/Sq Ft
Est. Value
About This Home
This home is located at 1014 Flint Cir Unit 3, Salinas, CA 93907 and is currently estimated at $630,588, approximately $568 per square foot. 1014 Flint Cir Unit 3 is a home located in Monterey County with nearby schools including Laurel Wood Elementary School, Roosevelt Elementary School, and Washington Middle School.
Ownership History
Date
Name
Owned For
Owner Type
Purchase Details
Closed on
Jul 28, 2000
Sold by
Foster Samuel J and Foster Lisa A
Bought by
Foster Samuel J and Foster Lisa A
Current Estimated Value
Home Financials for this Owner
Home Financials are based on the most recent Mortgage that was taken out on this home.
Original Mortgage
$187,500
Outstanding Balance
$67,505
Interest Rate
8.12%
Mortgage Type
Stand Alone First
Estimated Equity
$563,083
Purchase Details
Closed on
Jun 1, 1994
Sold by
Moore Louis C and Moore Eduarda S
Bought by
Foster Samuel and Kelley Lisa
Home Financials for this Owner
Home Financials are based on the most recent Mortgage that was taken out on this home.
Original Mortgage
$154,934
Interest Rate
8.53%
Mortgage Type
FHA
Create a Home Valuation Report for This Property
The Home Valuation Report is an in-depth analysis detailing your home's value as well as a comparison with similar homes in the area
Home Values in the Area
Average Home Value in this Area
Purchase History
| Date | Buyer | Sale Price | Title Company |
|---|---|---|---|
| Foster Samuel J | -- | American Title Company | |
| Foster Samuel | $159,000 | Chicago Title Company |
Source: Public Records
Mortgage History
| Date | Status | Borrower | Loan Amount |
|---|---|---|---|
| Open | Foster Samuel J | $187,500 | |
| Closed | Foster Samuel | $154,934 |
Source: Public Records
Tax History
| Year | Tax Paid | Tax Assessment Tax Assessment Total Assessment is a certain percentage of the fair market value that is determined by local assessors to be the total taxable value of land and additions on the property. | Land | Improvement |
|---|---|---|---|---|
| 2025 | $3,012 | $267,050 | $125,967 | $141,083 |
| 2024 | $3,012 | $261,815 | $123,498 | $138,317 |
| 2023 | $2,909 | $256,682 | $121,077 | $135,605 |
| 2022 | $2,798 | $251,650 | $118,703 | $132,947 |
| 2021 | $2,686 | $246,717 | $116,376 | $130,341 |
| 2020 | $2,612 | $244,188 | $115,183 | $129,005 |
| 2019 | $2,590 | $239,401 | $112,925 | $126,476 |
| 2018 | $2,555 | $234,708 | $110,711 | $123,997 |
| 2017 | $2,555 | $230,107 | $108,541 | $121,566 |
| 2016 | $2,555 | $225,596 | $106,413 | $119,183 |
| 2015 | $2,576 | $222,208 | $104,815 | $117,393 |
| 2014 | $2,403 | $217,856 | $102,762 | $115,094 |
Source: Public Records
Map
Nearby Homes
- 1075 Sherman Dr
- 1103 Sherman Dr
- 561 Powell St
- 1170 Tyler St
- 217 Iris Dr
- 350 Victor St
- 110 W Rossi St Unit 6
- 104 W Rossi St Unit 13
- 344 Pueblo Dr
- 230 Martella St
- 19 West St
- 23 Capitol St
- 89 Clark St
- 530 Inca Way
- 13 E Lake St
- 15 Saint Francis Way
- 24 Saint Francis Way
- 208 Diablo Dr
- 1515 Aragon Cir
- 234 Cherry Dr
- 1011 Flint Cir
- 1006 Flint Cir
- 788 Alvarado Dr
- 790 Alvarado Dr
- 786 Alvarado Dr
- 784 Alvarado Dr
- 792 Alvarado Dr
- 1007 Flint Cir
- 1002 Flint Cir
- 794 Alvarado Dr
- 782 Alvarado Dr
- 1022 Kearny Way Unit 3
- 646 Larkin St Unit 3
- 1018 Kearny Way
- 1003 Flint Cir
- 780 Alvarado Dr
- 1014 Kearny Way
- 642 Larkin St
- 787 Alvarado Dr
- 789 Alvarado Dr
Your Personal Tour Guide
Ask me questions while you tour the home.