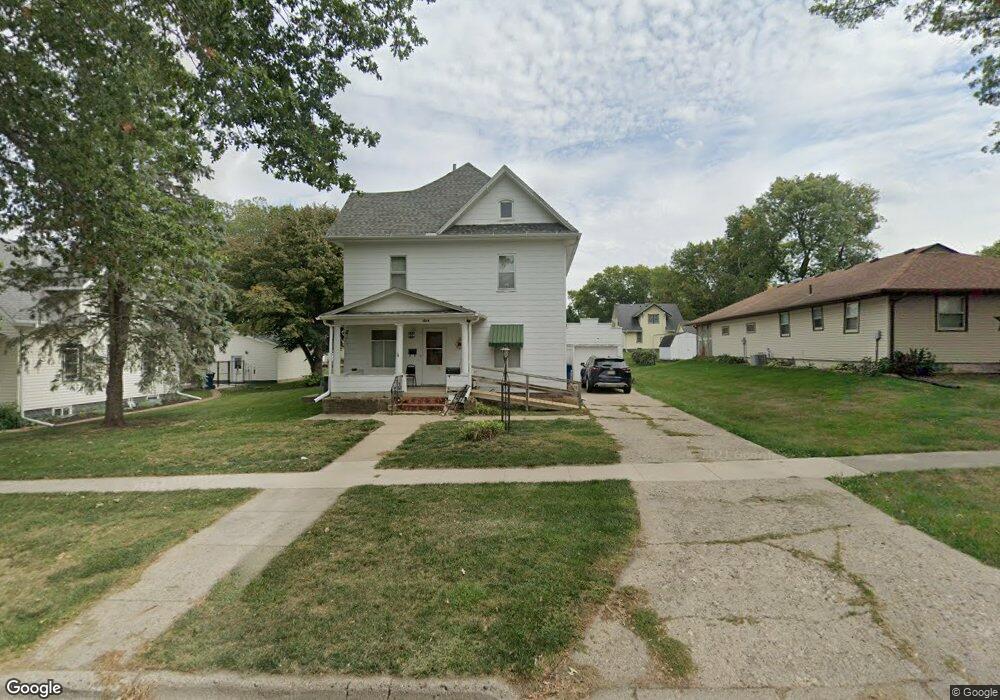
1014 Main St Manning, IA 51455
Estimated Value: $140,000 - $158,000
4
Beds
1
Bath
1,944
Sq Ft
$77/Sq Ft
Est. Value
About This Home
This home is located at 1014 Main St, Manning, IA 51455 and is currently estimated at $148,859, approximately $76 per square foot. 1014 Main St is a home with nearby schools including Ikm-Manning High School, IKM-Manning Middle School, and Irwin Elementary School.
Ownership History
Date
Name
Owned For
Owner Type
Purchase Details
Closed on
Aug 9, 2021
Sold by
Vennink Allen L and Vennink Patsy A
Bought by
Wagner Kyle M
Current Estimated Value
Home Financials for this Owner
Home Financials are based on the most recent Mortgage that was taken out on this home.
Original Mortgage
$92,000
Outstanding Balance
$83,492
Interest Rate
2.77%
Estimated Equity
$65,367
Purchase Details
Closed on
Oct 23, 2007
Sold by
Mohr Thelma
Bought by
Dammann Rickie Glynn and Dammann Sheryl L
Create a Home Valuation Report for This Property
The Home Valuation Report is an in-depth analysis detailing your home's value as well as a comparison with similar homes in the area
Purchase History
| Date | Buyer | Sale Price | Title Company |
|---|---|---|---|
| Wagner Kyle M | $115,000 | None Available | |
| Dammann Rickie Glynn | $17,500 | None Available |
Source: Public Records
Mortgage History
| Date | Status | Borrower | Loan Amount |
|---|---|---|---|
| Open | Wagner Kyle M | $92,000 |
Source: Public Records
Tax History
| Year | Tax Paid | Tax Assessment Tax Assessment Total Assessment is a certain percentage of the fair market value that is determined by local assessors to be the total taxable value of land and additions on the property. | Land | Improvement |
|---|---|---|---|---|
| 2025 | $994 | $81,010 | $12,860 | $68,150 |
| 2024 | $9 | $67,660 | $12,860 | $54,800 |
| 2023 | $1,082 | $67,660 | $12,860 | $54,800 |
| 2022 | $1,098 | $65,750 | $11,030 | $54,720 |
| 2021 | $1,082 | $65,750 | $11,030 | $54,720 |
| 2020 | $1,100 | $65,750 | $11,030 | $54,720 |
| 2019 | $1,054 | $65,750 | $11,030 | $54,720 |
| 2018 | $1,008 | $65,750 | $11,030 | $54,720 |
| 2017 | $976 | $60,765 | $8,656 | $52,109 |
| 2016 | $944 | $56,790 | $0 | $0 |
| 2015 | $944 | $53,300 | $0 | $0 |
| 2014 | $890 | $53,300 | $0 | $0 |
Source: Public Records
Map
Nearby Homes
Your Personal Tour Guide
Ask me questions while you tour the home.