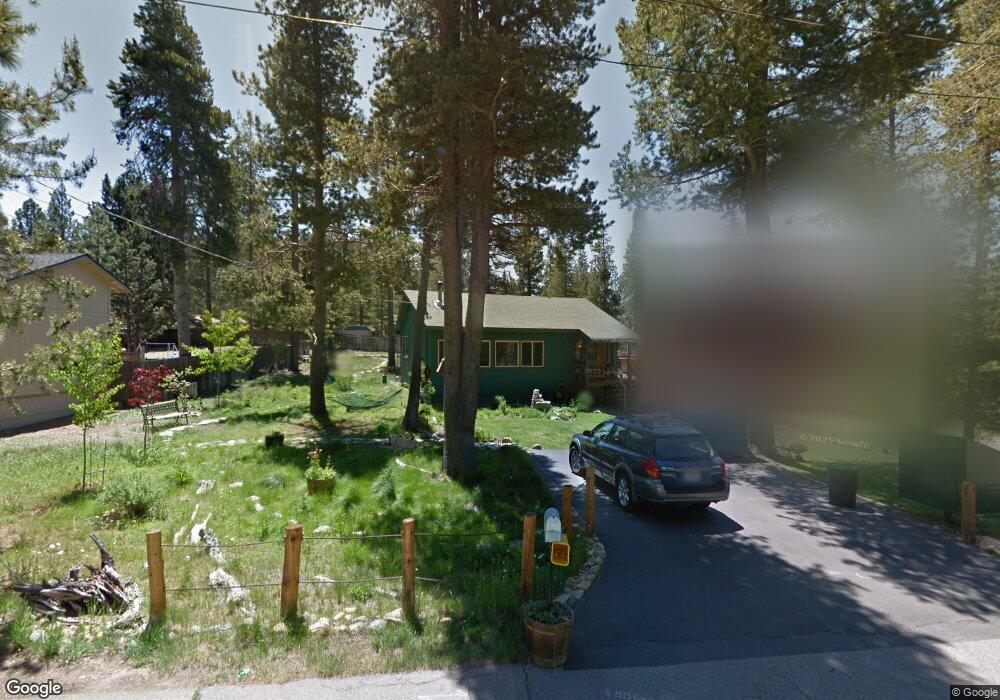
1014 Mohawk St South Lake Tahoe, CA 96150
Estimated Value: $448,261 - $558,000
2
Beds
1
Bath
946
Sq Ft
$539/Sq Ft
Est. Value
About This Home
This home is located at 1014 Mohawk St, South Lake Tahoe, CA 96150 and is currently estimated at $510,065, approximately $539 per square foot. 1014 Mohawk St is a home located in El Dorado County with nearby schools including Tahoe Valley Elementary School, South Tahoe Middle School, and South Tahoe High School.
Ownership History
Date
Name
Owned For
Owner Type
Purchase Details
Closed on
Jun 19, 2002
Sold by
Locicero Jeff
Bought by
Locicero Jeffrey E
Current Estimated Value
Purchase Details
Closed on
Jul 12, 1999
Sold by
Ruperto Barbara
Bought by
Locicero Jeffrey E
Home Financials for this Owner
Home Financials are based on the most recent Mortgage that was taken out on this home.
Original Mortgage
$88,000
Outstanding Balance
$24,338
Interest Rate
7.4%
Estimated Equity
$485,727
Purchase Details
Closed on
Nov 26, 1997
Sold by
Zaro Barbara G
Bought by
Cicero Jeff Lo and Ruberto Barbara
Home Financials for this Owner
Home Financials are based on the most recent Mortgage that was taken out on this home.
Original Mortgage
$97,350
Interest Rate
7.19%
Create a Home Valuation Report for This Property
The Home Valuation Report is an in-depth analysis detailing your home's value as well as a comparison with similar homes in the area
Home Values in the Area
Average Home Value in this Area
Purchase History
| Date | Buyer | Sale Price | Title Company |
|---|---|---|---|
| Locicero Jeffrey E | -- | Fidelity National Title Co | |
| Locicero Jeffrey E | -- | Fidelity National Title Co | |
| Cicero Jeff Lo | $102,500 | Placer Title Company |
Source: Public Records
Mortgage History
| Date | Status | Borrower | Loan Amount |
|---|---|---|---|
| Open | Locicero Jeffrey E | $88,000 | |
| Previous Owner | Cicero Jeff Lo | $97,350 |
Source: Public Records
Tax History Compared to Growth
Tax History
| Year | Tax Paid | Tax Assessment Tax Assessment Total Assessment is a certain percentage of the fair market value that is determined by local assessors to be the total taxable value of land and additions on the property. | Land | Improvement |
|---|---|---|---|---|
| 2025 | $1,713 | $160,421 | $46,943 | $113,478 |
| 2024 | $1,713 | $157,276 | $46,023 | $111,253 |
| 2023 | $1,683 | $154,193 | $45,121 | $109,072 |
| 2022 | $1,665 | $151,171 | $44,237 | $106,934 |
| 2021 | $1,636 | $148,208 | $43,370 | $104,838 |
| 2020 | $1,615 | $146,690 | $42,926 | $103,764 |
| 2019 | $1,606 | $143,815 | $42,085 | $101,730 |
| 2018 | $1,571 | $140,996 | $41,260 | $99,736 |
| 2017 | $1,545 | $138,232 | $40,451 | $97,781 |
| 2016 | $1,494 | $135,522 | $39,658 | $95,864 |
| 2015 | $1,437 | $133,488 | $39,063 | $94,425 |
| 2014 | $1,437 | $130,875 | $38,299 | $92,576 |
Source: Public Records
Map
Nearby Homes
- 1085 Mulberry Dr
- 2182 Lindenwood Dr
- 2189 Cornelian Dr
- 1982 Cherokee St
- 1140 Sioux St
- 2181 Pinewood Dr
- 0 Tomahawk Ln
- 2113 Oaxaco St
- 2255 Blitzen Rd
- 2263 Blitzen Rd
- 1935 Apache Ave
- 1940 Apache Ave
- 1444 Apache Ave
- 1871 Normuk St
- 2877 Us Highway 50
- 1889 Normuk St
- 1894 Normuk St
- 1502 Seminole Dr
- 1666 Arapahoe St
- 1774 Delaware St
- 1020 Mohawk St
- 1010 Mohawk St
- 1026 Mohawk St
- 2034 Arrowhead Ave
- 2028 Arrowhead Ave
- 2038 Arrowhead Ave
- 1032 Mohawk St
- 2022 Arrowhead Ave
- 1036 Mohawk St
- 2018 Arrowhead Ave
- 1040 Mohawk St
- 2029 Arrowhead Ave
- 1037 Mohawk St
- 2010 Arrowhead Ave
- 2008 Arrowhead Ave
- 1006 Crow St
- 2045 Arrowhead Ave
- 2035 Arrowhead Ave
- 1044 Mohawk St
- 1041 Mohawk St