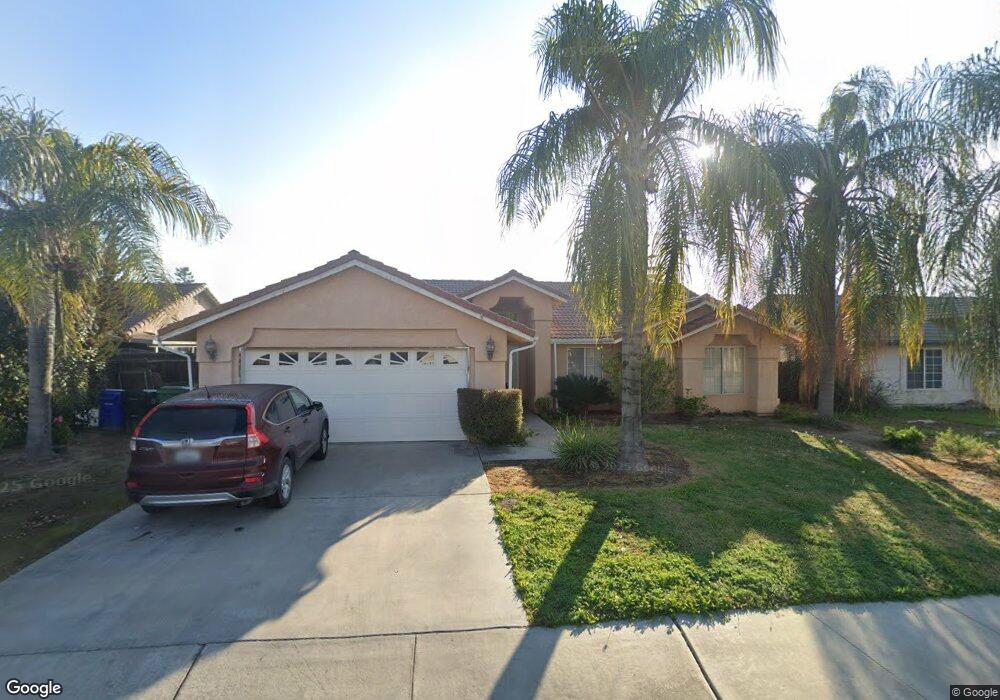
1014 N Sycamore Way Porterville, CA 93257
Porterville Northwest NeighborhoodEstimated Value: $345,000 - $409,000
3
Beds
2
Baths
1,538
Sq Ft
$239/Sq Ft
Est. Value
About This Home
This home is located at 1014 N Sycamore Way, Porterville, CA 93257 and is currently estimated at $367,323, approximately $238 per square foot. 1014 N Sycamore Way is a home located in Tulare County with nearby schools including William R. Buckley Elementary School, Burton Middle School, and Monache High School.
Ownership History
Date
Name
Owned For
Owner Type
Purchase Details
Closed on
Aug 13, 2009
Sold by
Favela Yolanda
Bought by
Martinez Maria T and Caldera Mario Y
Current Estimated Value
Home Financials for this Owner
Home Financials are based on the most recent Mortgage that was taken out on this home.
Original Mortgage
$162,011
Interest Rate
5%
Mortgage Type
FHA
Purchase Details
Closed on
Aug 1, 2007
Sold by
Favela Moises
Bought by
Favela Yolanda
Purchase Details
Closed on
May 25, 2007
Sold by
Ruiz Liliana
Bought by
Favela Yolanda
Purchase Details
Closed on
Jul 5, 2005
Sold by
Favela Moises
Bought by
Ruiz Liliana and Palomares Arcelia
Purchase Details
Closed on
Nov 8, 2001
Sold by
Meade Bruce
Bought by
Favela Moises and Favela Yolanda
Home Financials for this Owner
Home Financials are based on the most recent Mortgage that was taken out on this home.
Original Mortgage
$45,000
Interest Rate
6.51%
Create a Home Valuation Report for This Property
The Home Valuation Report is an in-depth analysis detailing your home's value as well as a comparison with similar homes in the area
Home Values in the Area
Average Home Value in this Area
Purchase History
| Date | Buyer | Sale Price | Title Company |
|---|---|---|---|
| Martinez Maria T | $165,000 | None Available | |
| Favela Yolanda | -- | Ticor Title Company Of Ca | |
| Favela Yolanda | -- | None Available | |
| Ruiz Liliana | -- | -- | |
| Favela Moises | $125,000 | Fidelity National Title Co |
Source: Public Records
Mortgage History
| Date | Status | Borrower | Loan Amount |
|---|---|---|---|
| Previous Owner | Martinez Maria T | $162,011 | |
| Previous Owner | Favela Moises | $45,000 |
Source: Public Records
Tax History Compared to Growth
Tax History
| Year | Tax Paid | Tax Assessment Tax Assessment Total Assessment is a certain percentage of the fair market value that is determined by local assessors to be the total taxable value of land and additions on the property. | Land | Improvement |
|---|---|---|---|---|
| 2025 | $2,305 | $212,982 | $51,632 | $161,350 |
| 2024 | $2,305 | $208,807 | $50,620 | $158,187 |
| 2023 | $2,364 | $204,714 | $49,628 | $155,086 |
| 2022 | $2,157 | $200,701 | $48,655 | $152,046 |
| 2021 | $2,240 | $196,766 | $47,701 | $149,065 |
| 2020 | $2,201 | $194,749 | $47,212 | $147,537 |
| 2019 | $2,200 | $190,930 | $46,286 | $144,644 |
| 2018 | $2,108 | $187,186 | $45,378 | $141,808 |
| 2017 | $1,960 | $183,515 | $44,488 | $139,027 |
| 2016 | $1,808 | $163,000 | $41,000 | $122,000 |
| 2015 | $1,644 | $165,000 | $41,000 | $124,000 |
| 2014 | $1,644 | $147,000 | $37,000 | $110,000 |
Source: Public Records
Map
Nearby Homes
- Sydney Plan at Laurelwood
- Carlton Plan at Laurelwood
- Hawthorne Plan at Brookside
- Henley Plan at Brookside
- Naples Plan at Laurelwood
- Walden Plan at Brookside
- Aspen with Loft Plan at Laurelwood
- Ashford Plan at Brookside
- Carmel Plan at Laurelwood
- Aspen Plan at Laurelwood
- Kipling Plan at Brookside
- 2261 W San Lucia Ct
- 2219 W Theta Ave
- 2164 W San Lucia Ct
- 2206 W Glenn Ct
- 2434 W Kanai Ave
- 575 N Brandy Way
- 2269 Pioneer Ave
- 1370 Camelot St
- Lot 30 2184 W Pioneer Ave
- 1004 N Sycamore Way
- 1024 N Sycamore Way
- 1021 N Jennifer Way
- 994 N Sycamore Way
- 1011 N Jennifer Way
- 1031 N Jennifer Way
- 1003 N Sycamore Way
- 1034 N Sycamore Way
- 1041 N Jennifer Way
- 993 N Sycamore Way
- 1013 N Sycamore Way
- 984 N Sycamore Way
- 991 N Jennifer Way
- 1044 N Sycamore Way
- 983 N Sycamore Way
- 1051 N Jennifer Way
- 1023 N Sycamore Way
- 974 N Sycamore Way
- 981 N Jennifer Way
- 1026 N Brandy Way