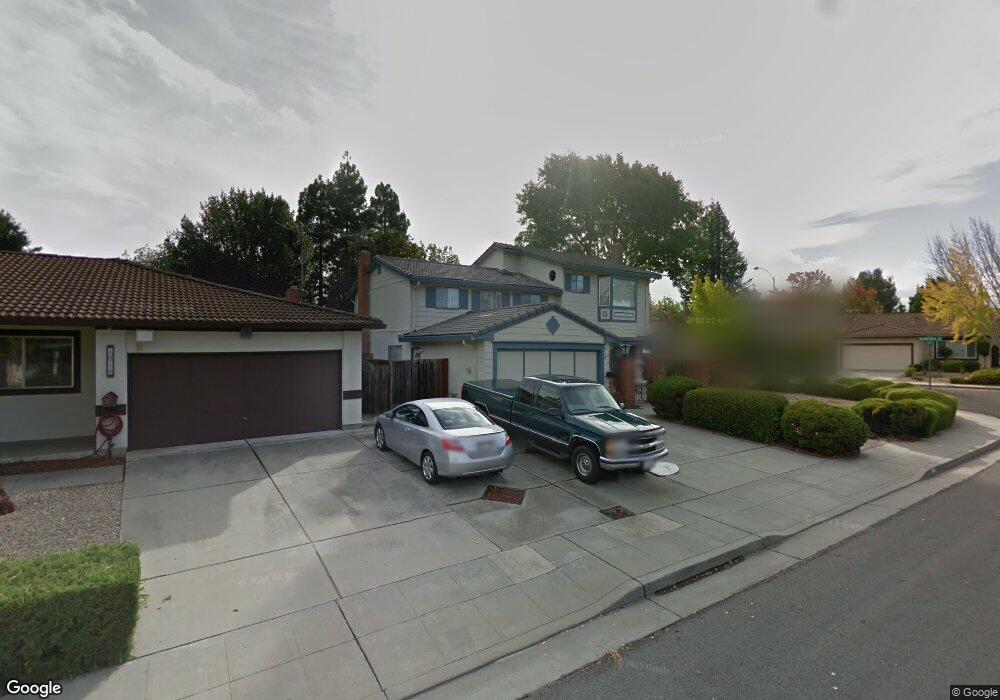
1014 Nandina Way Sunnyvale, CA 94086
Ponderosa Park NeighborhoodEstimated Value: $2,939,000 - $3,176,000
5
Beds
4
Baths
1,934
Sq Ft
$1,580/Sq Ft
Est. Value
About This Home
This home is located at 1014 Nandina Way, Sunnyvale, CA 94086 and is currently estimated at $3,055,009, approximately $1,579 per square foot. 1014 Nandina Way is a home located in Santa Clara County with nearby schools including Ponderosa Elementary School, Marian A. Peterson Middle School, and Adrian Wilcox High School.
Ownership History
Date
Name
Owned For
Owner Type
Purchase Details
Closed on
Mar 17, 2000
Sold by
Plummer Mark L and Plummer Shari A
Bought by
Plummer Mark L and Plummer Shari A
Current Estimated Value
Purchase Details
Closed on
Apr 22, 1999
Sold by
Eng Steven S And Carole W Trustee
Bought by
Plummer Mark L and Plummer Shari A
Home Financials for this Owner
Home Financials are based on the most recent Mortgage that was taken out on this home.
Original Mortgage
$300,000
Outstanding Balance
$75,586
Interest Rate
6.98%
Estimated Equity
$2,979,423
Purchase Details
Closed on
Dec 23, 1994
Sold by
Eng Steven Sze Kwong and Eng Carole Wai Yew
Bought by
Eng Steven Sze Kwong and Eng Carole Wai Yew
Purchase Details
Closed on
May 2, 1994
Sold by
Eng Steven Sze Kwong and Eng Carole Wai Yew
Bought by
Eng Steven Sze Kwong and Eng Carole Wai Yew
Create a Home Valuation Report for This Property
The Home Valuation Report is an in-depth analysis detailing your home's value as well as a comparison with similar homes in the area
Home Values in the Area
Average Home Value in this Area
Purchase History
| Date | Buyer | Sale Price | Title Company |
|---|---|---|---|
| Plummer Mark L | -- | -- | |
| Plummer Mark L | $610,000 | Fidelity National Title Co | |
| Eng Steven Sze Kwong | -- | -- | |
| Eng Steven Sze Kwong | -- | -- | |
| Eng Steven Sze Kwong | -- | -- |
Source: Public Records
Mortgage History
| Date | Status | Borrower | Loan Amount |
|---|---|---|---|
| Open | Plummer Mark L | $300,000 |
Source: Public Records
Tax History Compared to Growth
Tax History
| Year | Tax Paid | Tax Assessment Tax Assessment Total Assessment is a certain percentage of the fair market value that is determined by local assessors to be the total taxable value of land and additions on the property. | Land | Improvement |
|---|---|---|---|---|
| 2025 | $10,925 | $956,111 | $669,251 | $286,860 |
| 2024 | $10,925 | $937,365 | $656,129 | $281,236 |
| 2023 | $10,813 | $918,986 | $643,264 | $275,722 |
| 2022 | $10,630 | $900,967 | $630,651 | $270,316 |
| 2021 | $10,588 | $883,302 | $618,286 | $265,016 |
| 2020 | $10,395 | $874,246 | $611,947 | $262,299 |
| 2019 | $10,381 | $857,105 | $599,949 | $257,156 |
| 2018 | $9,712 | $840,300 | $588,186 | $252,114 |
| 2017 | $9,655 | $823,824 | $576,653 | $247,171 |
| 2016 | $9,444 | $807,672 | $565,347 | $242,325 |
| 2015 | $9,408 | $795,541 | $556,855 | $238,686 |
| 2014 | $8,957 | $779,958 | $545,947 | $234,011 |
Source: Public Records
Map
Nearby Homes
- 998 Rosa Ct
- 922 Iris Ave
- 3725 Terstena Place Unit 140
- 959 Reed Ave
- 3715 Terstena Place Unit 202
- 1061 Azalea Dr
- 3705 Terstena Place Unit 201
- 929 E El Camino Real Unit 320E
- 1201 Sycamore Terrace Unit 148
- 474 Sequoia Dr
- 750 Calla Dr
- 1750 Halford Ave Unit 101
- 1038 Barberry Terrace
- 1103 Reed Ave Unit A
- Rey Plan at 3131 Camino
- Asis Plan at 3131 Camino
- Soledad Plan at 3131 Camino
- Arya Plan at 3131 Camino
- Sarria Plan at 3131 Camino
- Zara Plan at 3131 Camino
- 1016 Nandina Way
- 860 Quintinia Dr
- 1018 Nandina Way
- 851 Quintinia Dr
- 843 Quintinia Dr
- 1015 Nandina Way
- 859 Quintinia Dr
- 1013 Nandina Way
- 1017 Nandina Way
- 835 Quintinia Dr
- 1020 Nandina Way
- 869 Quintinia Dr
- 1011 Nandina Way
- 875 Poppy Ct
- 1021 Nandina Way
- 878 Quintinia Dr
- 871 Poppy Ct
- 844 Poplar Ave
- 879 Quintinia Dr
- 848 Poplar Ave