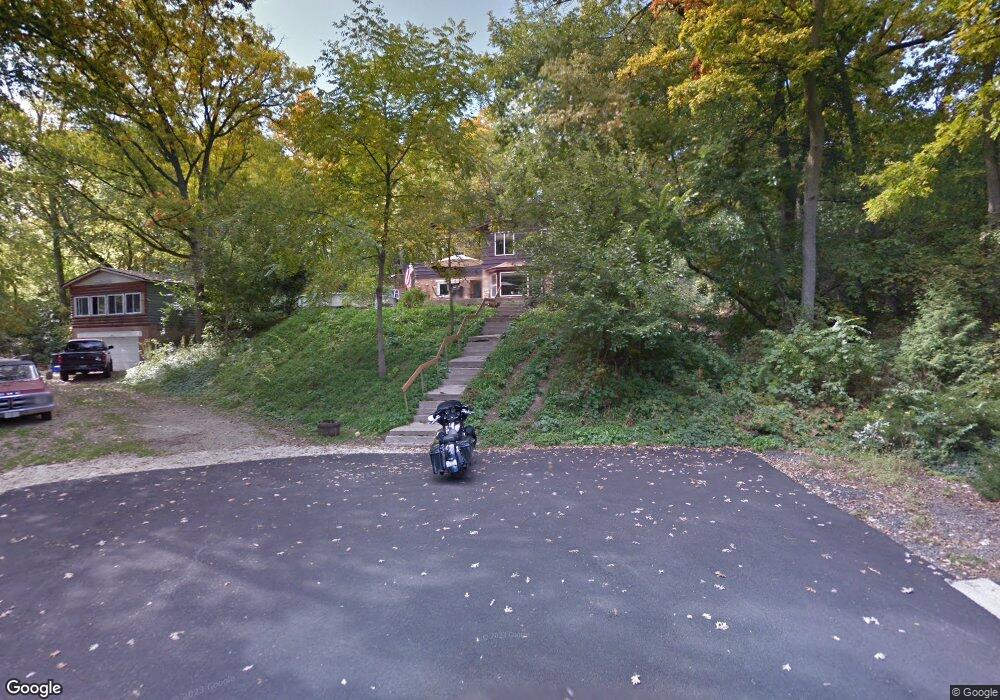
1014 W Dale Ave McHenry, IL 60051
Estimated Value: $258,000 - $295,000
2
Beds
1
Bath
1,860
Sq Ft
$149/Sq Ft
Est. Value
About This Home
This home is located at 1014 W Dale Ave, McHenry, IL 60051 and is currently estimated at $277,564, approximately $149 per square foot. 1014 W Dale Ave is a home located in McHenry County with nearby schools including Hilltop Elementary School, Chauncey H Duker School, and Mchenry Middle School.
Ownership History
Date
Name
Owned For
Owner Type
Purchase Details
Closed on
Nov 15, 2018
Sold by
Weiler Timothy Scott
Bought by
Miller Bradley
Current Estimated Value
Home Financials for this Owner
Home Financials are based on the most recent Mortgage that was taken out on this home.
Original Mortgage
$150,000
Outstanding Balance
$131,895
Interest Rate
4.8%
Mortgage Type
Unknown
Estimated Equity
$145,669
Purchase Details
Closed on
Jul 10, 2012
Sold by
Weiler William Scott
Bought by
Weiler Timothy Scott
Purchase Details
Closed on
Sep 22, 2011
Sold by
Maxson Adam P and Maxson Faith
Bought by
Weiler William S
Home Financials for this Owner
Home Financials are based on the most recent Mortgage that was taken out on this home.
Original Mortgage
$84,800
Interest Rate
4.14%
Mortgage Type
New Conventional
Create a Home Valuation Report for This Property
The Home Valuation Report is an in-depth analysis detailing your home's value as well as a comparison with similar homes in the area
Home Values in the Area
Average Home Value in this Area
Purchase History
| Date | Buyer | Sale Price | Title Company |
|---|---|---|---|
| Miller Bradley | $160,000 | None Available | |
| Weiler Timothy Scott | -- | None Available | |
| Weiler Timothy Scott | -- | None Available | |
| Weiler William S | $106,000 | Fidelity Natl Title |
Source: Public Records
Mortgage History
| Date | Status | Borrower | Loan Amount |
|---|---|---|---|
| Open | Miller Bradley | $150,000 | |
| Previous Owner | Weiler William S | $84,800 |
Source: Public Records
Tax History Compared to Growth
Tax History
| Year | Tax Paid | Tax Assessment Tax Assessment Total Assessment is a certain percentage of the fair market value that is determined by local assessors to be the total taxable value of land and additions on the property. | Land | Improvement |
|---|---|---|---|---|
| 2024 | $6,039 | $75,712 | $13,518 | $62,194 |
| 2023 | $5,901 | $67,830 | $12,111 | $55,719 |
| 2022 | $5,613 | $62,928 | $11,236 | $51,692 |
| 2021 | $5,361 | $58,603 | $10,464 | $48,139 |
| 2020 | $5,194 | $56,160 | $10,028 | $46,132 |
| 2019 | $5,134 | $53,328 | $9,522 | $43,806 |
| 2018 | $5,403 | $56,382 | $9,090 | $47,292 |
| 2017 | $5,171 | $52,916 | $8,531 | $44,385 |
| 2016 | $4,978 | $49,454 | $7,973 | $41,481 |
| 2013 | -- | $41,992 | $7,850 | $34,142 |
Source: Public Records
Map
Nearby Homes
- 312 N Cresthill Ave
- 1008 W Dale Ave
- 803 East Blvd
- 0 Rand Rd
- 132 Rand Rd
- 336 Rosedale Dr
- 4406 Gray Wolf Cir
- 3237 Jori Ln
- 3315 Jori Ln
- 3905 Riverside Dr
- 3907 Riverside Dr
- 3214 Jori Ln
- 3301 Bergamot Path
- 3233 Jori Ln
- 3307 Jori Ln
- 31918 Hillside Dr
- 0000 Fairview Ave
- 135 Lotus Dr
- 104 Morningside Dr
- 95 W South Dr
- 218 N Cresthill Ave
- blk 26 Dale Ave
- 301 N Cresthill Ave
- 1010 W Dale Ave
- 1012 W Dale Ave
- 32474 N Rushmore Ave Unit 1
- 1006 Ravine Ave
- 1015 Ravine Ave
- 1001 W Dale Ave
- 1006 W Dale Ave
- 1011 Ridgewood Ave
- 1009 Ravine Ave
- 1007 Ridgewood Ave
- 1005 Ridgewood Ave
- 1007 Ravine Ave
- 306 N Cresthill Ave
- 306 N Cresthill Ave
- 919 W Dale Ave
- 1004 Ravine Ave
- 921 Ridgewood Ave