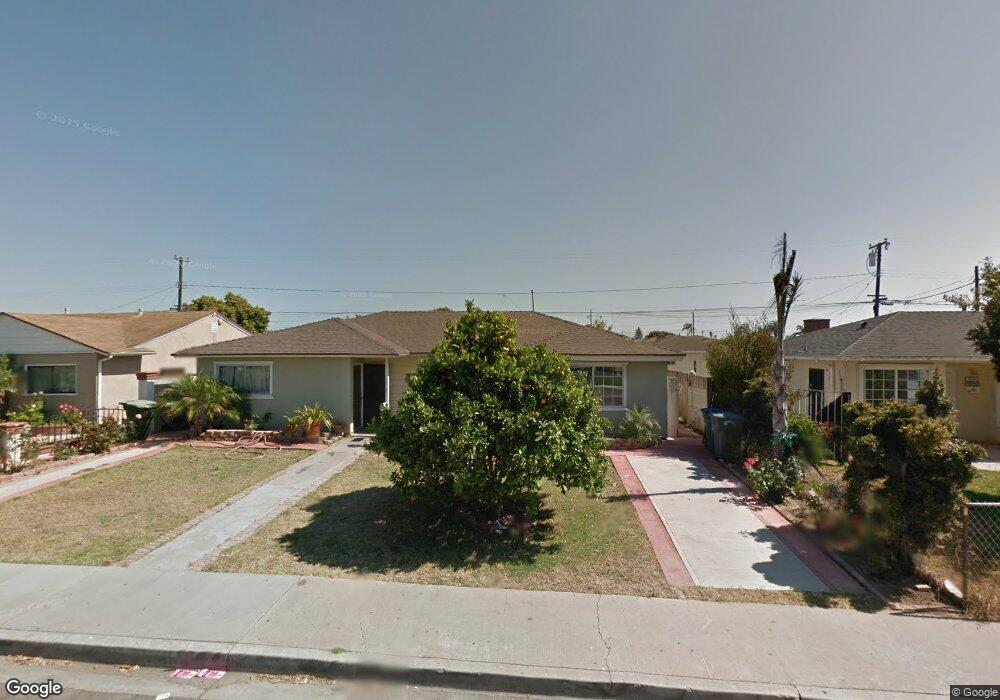
1014 W Hemlock St Oxnard, CA 93033
Bartolo Square South NeighborhoodEstimated Value: $629,000 - $783,000
4
Beds
3
Baths
1,112
Sq Ft
$629/Sq Ft
Est. Value
About This Home
This home is located at 1014 W Hemlock St, Oxnard, CA 93033 and is currently estimated at $698,920, approximately $628 per square foot. 1014 W Hemlock St is a home located in Ventura County with nearby schools including Kamala School, Oxnard High School, and St. Anthony's Elementary School.
Ownership History
Date
Name
Owned For
Owner Type
Purchase Details
Closed on
Jun 25, 2003
Sold by
Oy Rafael
Bought by
Oy Rafael and Oy Melba
Current Estimated Value
Home Financials for this Owner
Home Financials are based on the most recent Mortgage that was taken out on this home.
Original Mortgage
$204,000
Outstanding Balance
$85,983
Interest Rate
5.26%
Mortgage Type
Purchase Money Mortgage
Estimated Equity
$612,937
Purchase Details
Closed on
Apr 24, 1998
Sold by
Oy Rafael and Oy Melba
Bought by
Oy Rafael and Oy Melba
Home Financials for this Owner
Home Financials are based on the most recent Mortgage that was taken out on this home.
Original Mortgage
$126,689
Interest Rate
7.06%
Mortgage Type
FHA
Purchase Details
Closed on
Apr 4, 1997
Sold by
Oy Jose Manuel and Oy Maria Rosario
Bought by
Oy Rafael and Oy Melba
Purchase Details
Closed on
Dec 2, 1995
Sold by
Gutierrez Adam C and Gutierrez Linda A
Bought by
Oy Rafael and Oy Melba
Home Financials for this Owner
Home Financials are based on the most recent Mortgage that was taken out on this home.
Original Mortgage
$128,736
Interest Rate
7.14%
Mortgage Type
FHA
Create a Home Valuation Report for This Property
The Home Valuation Report is an in-depth analysis detailing your home's value as well as a comparison with similar homes in the area
Home Values in the Area
Average Home Value in this Area
Purchase History
| Date | Buyer | Sale Price | Title Company |
|---|---|---|---|
| Oy Rafael | -- | Ticor Title Company | |
| Oy Rafael | $63,500 | Fidelity National Title Co | |
| Oy Rafael | -- | -- | |
| Oy Rafael | $130,000 | Chicago Title Co |
Source: Public Records
Mortgage History
| Date | Status | Borrower | Loan Amount |
|---|---|---|---|
| Open | Oy Rafael | $204,000 | |
| Closed | Oy Rafael | $126,689 | |
| Previous Owner | Oy Rafael | $128,736 |
Source: Public Records
Tax History
| Year | Tax Paid | Tax Assessment Tax Assessment Total Assessment is a certain percentage of the fair market value that is determined by local assessors to be the total taxable value of land and additions on the property. | Land | Improvement |
|---|---|---|---|---|
| 2025 | $2,752 | $231,286 | $86,370 | $144,916 |
| 2024 | $2,752 | $226,751 | $84,676 | $142,075 |
| 2023 | $2,651 | $222,305 | $83,015 | $139,290 |
| 2022 | $2,570 | $217,947 | $81,388 | $136,559 |
| 2021 | $2,548 | $213,674 | $79,792 | $133,882 |
| 2020 | $2,594 | $211,485 | $78,975 | $132,510 |
| 2019 | $2,520 | $207,339 | $77,427 | $129,912 |
| 2018 | $3,779 | $203,274 | $75,909 | $127,365 |
| 2017 | $2,356 | $199,289 | $74,421 | $124,868 |
| 2016 | $2,356 | $195,382 | $72,962 | $122,420 |
| 2015 | $2,381 | $192,449 | $71,867 | $120,582 |
| 2014 | $2,355 | $188,681 | $70,460 | $118,221 |
Source: Public Records
Map
Nearby Homes
- 2024 S J St
- 1431 Casa San Carlos Ln Unit B
- 257 E Garden Green
- 225 W Iris St
- 269 E Elfin Green
- 236 E Bay Blvd
- 1239 S C St
- 137 E Garden Green
- 1030 Ilena St
- 111 E Bay Blvd
- 1127 S C St
- 13 W Garden Green
- 1140 Teakwood St
- 31 W Delta Green
- 75 W Fiesta Green
- 83 W Garden Green
- 1820 Claremont Dr
- 102 W Alta Green
- 1174 Oyster Place Unit 15
- 2213 Miramar Walk
- 1004 W Hemlock St
- 1024 W Hemlock St
- 1000 W Hemlock St
- 1104 W Hemlock St
- 938 W Hemlock St
- 1023 W Iris St
- 1015 W Iris St
- 1033 W Iris St
- 1015 W Hemlock St
- 1043 W Iris St
- 1005 W Iris St
- 1025 W Hemlock St
- 1005 W Hemlock St
- 1114 W Hemlock St
- 928 W Hemlock St
- 935 W Hemlock St
- 941 W Iris St
- 1107 W Iris St
- 1105 W Hemlock St
- 1124 W Hemlock St
Your Personal Tour Guide
Ask me questions while you tour the home.