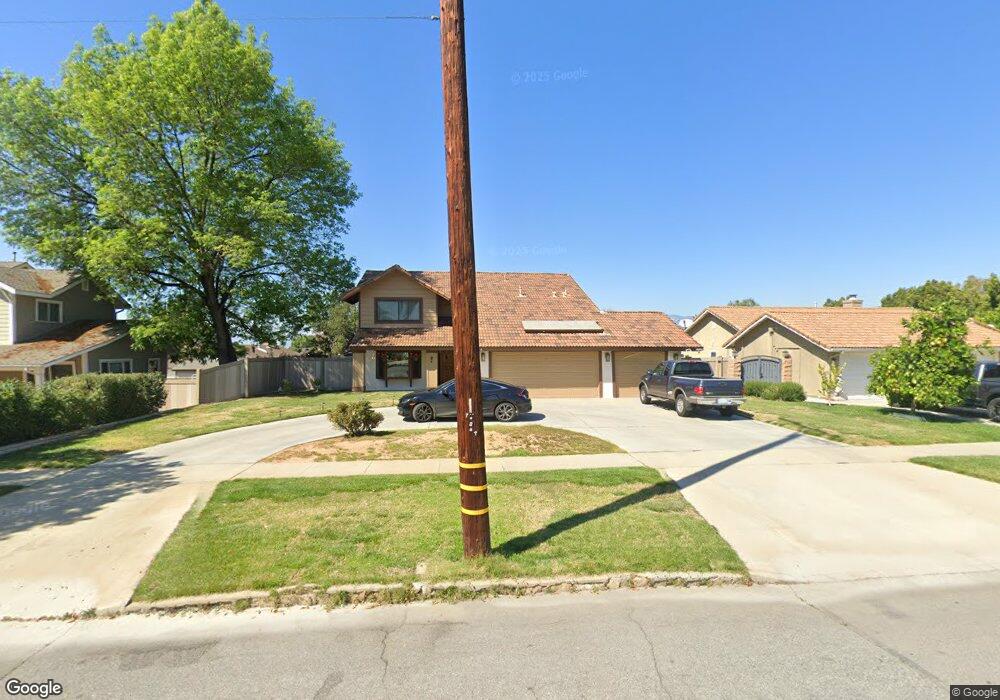
1014 W Olive Ave Redlands, CA 92373
South Redlands NeighborhoodEstimated Value: $723,000 - $840,000
4
Beds
3
Baths
2,397
Sq Ft
$327/Sq Ft
Est. Value
About This Home
This home is located at 1014 W Olive Ave, Redlands, CA 92373 and is currently estimated at $784,931, approximately $327 per square foot. 1014 W Olive Ave is a home located in San Bernardino County with nearby schools including McKinley Elementary School, Cope Middle School, and Redlands Senior High School.
Ownership History
Date
Name
Owned For
Owner Type
Purchase Details
Closed on
Jun 6, 2001
Sold by
Lonergan Patrick J and Lonergan Elizabeth A
Bought by
Backes John A and Backes Peggy A
Current Estimated Value
Home Financials for this Owner
Home Financials are based on the most recent Mortgage that was taken out on this home.
Original Mortgage
$212,000
Outstanding Balance
$81,463
Interest Rate
7.26%
Estimated Equity
$703,469
Create a Home Valuation Report for This Property
The Home Valuation Report is an in-depth analysis detailing your home's value as well as a comparison with similar homes in the area
Home Values in the Area
Average Home Value in this Area
Purchase History
| Date | Buyer | Sale Price | Title Company |
|---|---|---|---|
| Backes John A | $265,000 | Nations Title Insurance Co |
Source: Public Records
Mortgage History
| Date | Status | Borrower | Loan Amount |
|---|---|---|---|
| Open | Backes John A | $212,000 | |
| Closed | Backes John A | $26,500 |
Source: Public Records
Tax History Compared to Growth
Tax History
| Year | Tax Paid | Tax Assessment Tax Assessment Total Assessment is a certain percentage of the fair market value that is determined by local assessors to be the total taxable value of land and additions on the property. | Land | Improvement |
|---|---|---|---|---|
| 2025 | $4,472 | $391,489 | $97,872 | $293,617 |
| 2024 | $4,472 | $383,813 | $95,953 | $287,860 |
| 2023 | $4,465 | $376,288 | $94,072 | $282,216 |
| 2022 | $4,399 | $368,909 | $92,227 | $276,682 |
| 2021 | $4,478 | $361,676 | $90,419 | $271,257 |
| 2020 | $4,410 | $357,968 | $89,492 | $268,476 |
| 2019 | $4,285 | $350,949 | $87,737 | $263,212 |
| 2018 | $4,177 | $344,068 | $86,017 | $258,051 |
| 2017 | $4,140 | $337,321 | $84,330 | $252,991 |
| 2016 | $4,092 | $330,706 | $82,676 | $248,030 |
| 2015 | $4,060 | $325,738 | $81,434 | $244,304 |
| 2014 | $3,985 | $319,357 | $79,839 | $239,518 |
Source: Public Records
Map
Nearby Homes
- 133 S San Mateo St
- 24 S Ash St
- 975 Brookside Ave
- 1239 Fulbright Ave
- 350 Sherwood St
- 325 Lakeside Ave
- 162 Lakeside Ave
- 1302 San Pablo Ave
- 628 W Fern Ave
- 87 Tennessee St Unit C
- 521 Bond St
- 108 S Buena Vista St
- 91 Tennessee St Unit C
- 230 S Buena Vista St
- 1044 W Cypress Ave
- 1110 W Cypress Ave
- 51 Orangewood Ct
- 9440 Hollie Dr
- 1324 W Fern Ave
- 108 N Center St
- 1012 W Olive Ave
- 1016 W Olive Ave
- 124 Dale Ln
- 133 San Jacinto St
- 1008 W Olive Ave
- 120 Dale Ln
- 1005 Hamlin Place
- 136 San Jacinto St
- 200 Fremont St
- 205 Fremont St
- 129 San Jacinto St
- 122 Nanette St
- 1023 W Olive Ave
- 1106 W Olive Ave
- 132 San Jacinto St
- 1001 Hamlin Place
- 1007 W Olive Ave
- 130 San Jacinto St
- 215 Fremont St
- 105 San Jacinto St