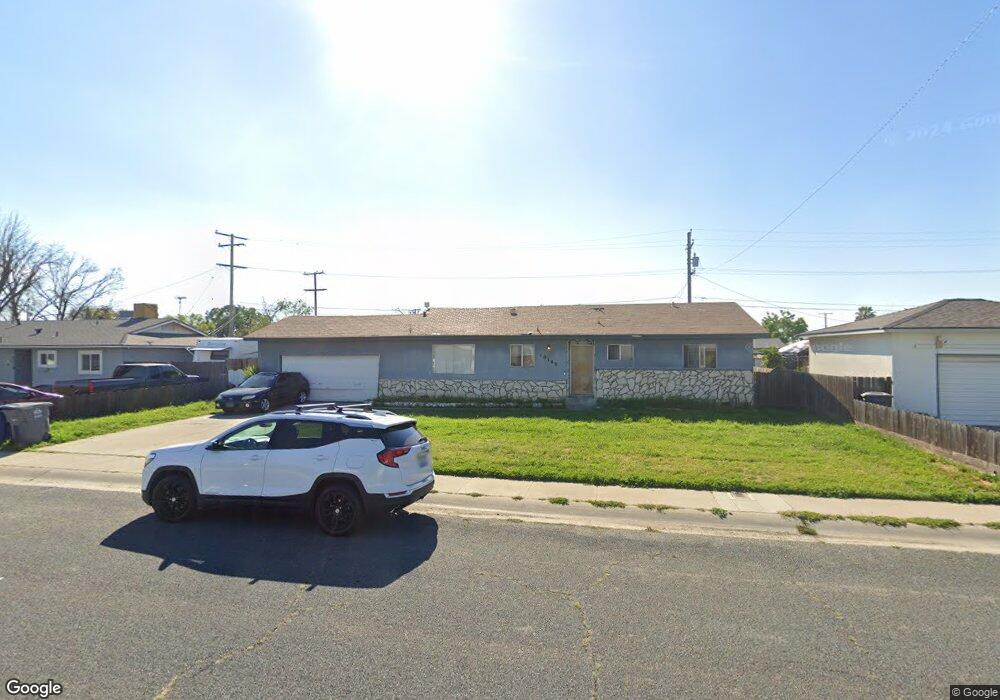
10142 David St Hanford, CA 93230
Estimated Value: $270,000 - $290,929
3
Beds
2
Baths
1,293
Sq Ft
$218/Sq Ft
Est. Value
About This Home
This home is located at 10142 David St, Hanford, CA 93230 and is currently estimated at $281,732, approximately $217 per square foot. 10142 David St is a home located in Kings County with nearby schools including Kit Carson Elementary School, Hanford High School, and Heritage Christian Academy.
Ownership History
Date
Name
Owned For
Owner Type
Purchase Details
Closed on
Aug 29, 2003
Sold by
Desilva David A
Bought by
Desilva David A and David A Desilva Trust
Current Estimated Value
Purchase Details
Closed on
Aug 7, 2003
Sold by
Desilva Svetlana
Bought by
Desilva David A
Purchase Details
Closed on
Mar 22, 2000
Sold by
Desilva David
Bought by
Desilva David A and The David A Desilva Trust
Purchase Details
Closed on
Apr 21, 1998
Sold by
Desilva Svetlana
Bought by
Desilva David
Purchase Details
Closed on
Feb 16, 1998
Sold by
Lee Cynthia
Bought by
Desilva David
Home Financials for this Owner
Home Financials are based on the most recent Mortgage that was taken out on this home.
Original Mortgage
$54,000
Interest Rate
7.06%
Create a Home Valuation Report for This Property
The Home Valuation Report is an in-depth analysis detailing your home's value as well as a comparison with similar homes in the area
Home Values in the Area
Average Home Value in this Area
Purchase History
| Date | Buyer | Sale Price | Title Company |
|---|---|---|---|
| Desilva David A | -- | -- | |
| Desilva David A | -- | Hanford Title Company | |
| Desilva David A | -- | Hanford Title Company | |
| Desilva David A | -- | -- | |
| Desilva David | -- | Chicago Title Co | |
| Desilva David | $60,000 | Chicago Title Co |
Source: Public Records
Mortgage History
| Date | Status | Borrower | Loan Amount |
|---|---|---|---|
| Previous Owner | Desilva David | $54,000 |
Source: Public Records
Tax History Compared to Growth
Tax History
| Year | Tax Paid | Tax Assessment Tax Assessment Total Assessment is a certain percentage of the fair market value that is determined by local assessors to be the total taxable value of land and additions on the property. | Land | Improvement |
|---|---|---|---|---|
| 2025 | $996 | $95,804 | $36,722 | $59,082 |
| 2023 | $996 | $92,086 | $35,297 | $56,789 |
| 2022 | $958 | $90,281 | $34,605 | $55,676 |
| 2021 | $939 | $88,512 | $33,927 | $54,585 |
| 2020 | $939 | $87,604 | $33,579 | $54,025 |
| 2019 | $931 | $85,887 | $32,921 | $52,966 |
| 2018 | $914 | $84,202 | $32,275 | $51,927 |
| 2017 | $893 | $82,551 | $31,642 | $50,909 |
| 2016 | $869 | $80,933 | $31,022 | $49,911 |
| 2015 | $860 | $79,717 | $30,556 | $49,161 |
| 2014 | $848 | $78,155 | $29,957 | $48,198 |
Source: Public Records
Map
Nearby Homes
- 10126 David St
- 8550 La Vaca Way
- 10158 David St
- 8565 La Vaca Way
- 10139 David St
- 10110 David St
- 10155 David St
- 8558 Curtis St
- 8560 La Vaca Way
- 8542 Curtis St
- 8572 Curtis St
- 8585 La Vaca Way
- 10107 David St
- 8512 Curtis St
- 8580 La Vaca Way
- 10086 David St
- 8551 Eddy St
- 10093 David St
- 8557 Curtis St
- 8541 Curtis St