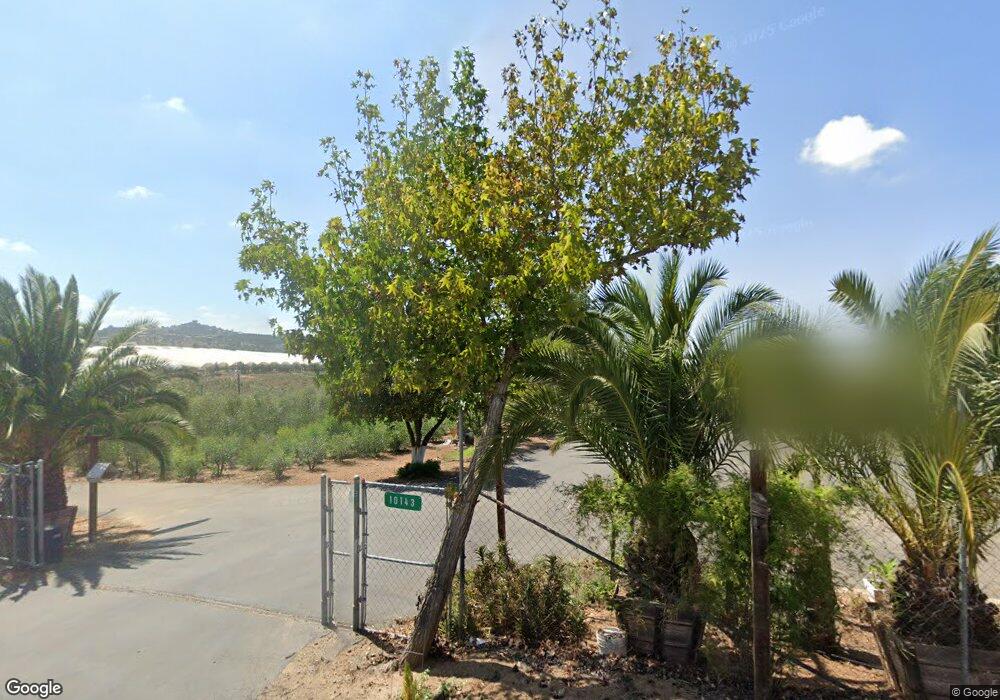
10143 W Lilac Rd Escondido, CA 92026
Estimated Value: $1,500,000 - $2,547,000
9
Beds
5
Baths
3,004
Sq Ft
$607/Sq Ft
Est. Value
About This Home
This home is located at 10143 W Lilac Rd, Escondido, CA 92026 and is currently estimated at $1,822,409, approximately $606 per square foot. 10143 W Lilac Rd is a home located in San Diego County with nearby schools including Lilac, Valley Center Middle School, and Valley Center High School.
Ownership History
Date
Name
Owned For
Owner Type
Purchase Details
Closed on
Dec 18, 2011
Sold by
Valencia Juvencio and Valencia Francisca
Bought by
The Juvencio & Francisca Valencia Living
Current Estimated Value
Purchase Details
Closed on
Jun 26, 2011
Sold by
Valencia Juvencio and Valencia Francisca
Bought by
Valencia Juvencio L and Valencia Francisca
Purchase Details
Closed on
May 19, 2005
Sold by
Chen Michael Du Fu and Chen Jenny Sue Zing
Bought by
Valencia Juvencio and Valencia Francisca
Home Financials for this Owner
Home Financials are based on the most recent Mortgage that was taken out on this home.
Original Mortgage
$600,000
Interest Rate
6.99%
Mortgage Type
Fannie Mae Freddie Mac
Purchase Details
Closed on
Jul 15, 1992
Purchase Details
Closed on
Aug 11, 1987
Create a Home Valuation Report for This Property
The Home Valuation Report is an in-depth analysis detailing your home's value as well as a comparison with similar homes in the area
Home Values in the Area
Average Home Value in this Area
Purchase History
| Date | Buyer | Sale Price | Title Company |
|---|---|---|---|
| The Juvencio & Francisca Valencia Living | -- | None Available | |
| Valencia Juvencio L | -- | None Available | |
| Valencia Juvencio | $1,100,000 | First American Title Co | |
| -- | $500,000 | -- | |
| -- | $113,000 | -- |
Source: Public Records
Mortgage History
| Date | Status | Borrower | Loan Amount |
|---|---|---|---|
| Previous Owner | Valencia Juvencio | $200,000 | |
| Previous Owner | Valencia Juvencio | $600,000 |
Source: Public Records
Tax History Compared to Growth
Tax History
| Year | Tax Paid | Tax Assessment Tax Assessment Total Assessment is a certain percentage of the fair market value that is determined by local assessors to be the total taxable value of land and additions on the property. | Land | Improvement |
|---|---|---|---|---|
| 2025 | $18,625 | $1,530,024 | $956,601 | $573,423 |
| 2024 | $18,625 | $1,500,025 | $937,845 | $562,180 |
| 2023 | $18,184 | $1,470,613 | $919,456 | $551,157 |
| 2022 | $17,883 | $1,441,778 | $901,428 | $540,350 |
| 2021 | $17,484 | $1,413,508 | $883,753 | $529,755 |
| 2020 | $17,324 | $1,399,016 | $874,692 | $524,324 |
| 2019 | $17,364 | $1,371,586 | $857,542 | $514,044 |
| 2018 | $16,891 | $1,344,693 | $840,728 | $503,965 |
| 2017 | $941 | $1,318,328 | $824,244 | $494,084 |
| 2016 | $16,547 | $1,292,480 | $808,083 | $484,397 |
| 2015 | $16,173 | $1,273,066 | $795,945 | $477,121 |
| 2014 | $15,815 | $1,248,129 | $780,354 | $467,775 |
Source: Public Records
Map
Nearby Homes
- 10350 W Lilac Rd
- 30427 Circle r Ln
- 30508 Circle r Ln
- 30015 Ridge Creek Rd
- 9562 Covey Ln
- 31844 Patrick Way
- 0 Circle r Dr
- 0 Ridge Creek Rd Unit NDP2508679
- 0 Circle r Dr
- 15 Circle r Dr
- 30727 Rolling Hills Dr
- 30136 Rolling Hills Dr
- 11591 Frog Hollow
- 9946 Nutby Ln
- 8310 Nelson Way Unit 98
- 9431 W Lilac Rd
- 29825 Platanus Dr
- 9168 Old Castle Rd
- 29711 Williams Valley Ct
- 31659-61 Rocking Horse Rd
- 10135 W Lilac Rd
- 9914 W Lilac Rd
- 10136 W Lilac Rd
- 10142 W Lilac Rd
- 10128 W Lilac Rd
- 10154 W Lilac Rd
- 10126 W Lilac Rd
- 10132 W Lilac Rd
- 10129 W Lilac Rd
- 10113 W Lilac Rd
- 10121 W Lilac Rd
- 9865 W Lilac Rd
- 10119 W Lilac Rd
- 10109 W Lilac Rd
- 10107 W Lilac Rd
- 10216 W Lilac Rd
- 10246 W Lilac Rd
- 10314 Lal Bagh Ln
- 10111 W Lilac Rd
- 10332 Lal Bagh Ln