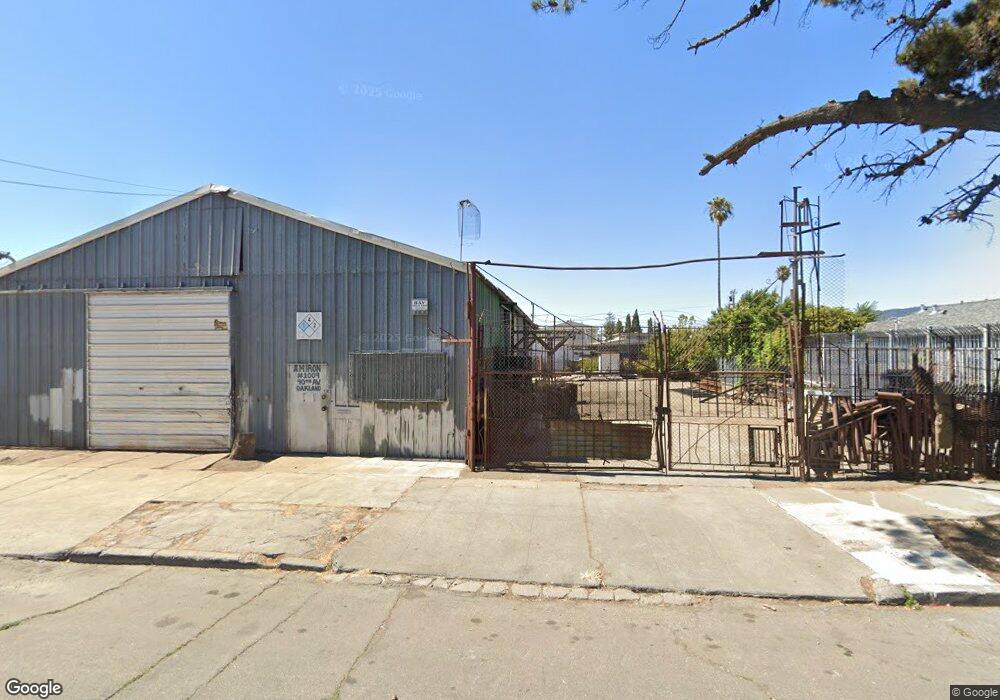
1015 90th Ave Oakland, CA 94603
Highland NeighborhoodEstimated Value: $780,090
Studio
1
Bath
3,200
Sq Ft
$244/Sq Ft
Est. Value
About This Home
This home is located at 1015 90th Ave, Oakland, CA 94603 and is currently estimated at $780,090, approximately $243 per square foot. 1015 90th Ave is a home located in Alameda County with nearby schools including New Highland Academy, Encompass Academy Elementary, and Acorn Woodland Elementary School.
Ownership History
Date
Name
Owned For
Owner Type
Purchase Details
Closed on
Mar 2, 2023
Sold by
Magallanez Alfredo
Bought by
Lm Incognito Llc
Current Estimated Value
Home Financials for this Owner
Home Financials are based on the most recent Mortgage that was taken out on this home.
Original Mortgage
$390,000
Outstanding Balance
$375,075
Interest Rate
6.13%
Mortgage Type
New Conventional
Estimated Equity
$405,015
Create a Home Valuation Report for This Property
The Home Valuation Report is an in-depth analysis detailing your home's value as well as a comparison with similar homes in the area
Home Values in the Area
Average Home Value in this Area
Purchase History
| Date | Buyer | Sale Price | Title Company |
|---|---|---|---|
| Lm Incognito Llc | $780,000 | First American Title |
Source: Public Records
Mortgage History
| Date | Status | Borrower | Loan Amount |
|---|---|---|---|
| Open | Lm Incognito Llc | $390,000 |
Source: Public Records
Tax History
| Year | Tax Paid | Tax Assessment Tax Assessment Total Assessment is a certain percentage of the fair market value that is determined by local assessors to be the total taxable value of land and additions on the property. | Land | Improvement |
|---|---|---|---|---|
| 2025 | $12,541 | $811,512 | $572,220 | $239,292 |
| 2024 | $12,541 | $795,600 | $561,000 | $234,600 |
| 2023 | $4,875 | $177,584 | $64,576 | $113,008 |
| 2022 | $4,620 | $174,102 | $63,310 | $110,792 |
| 2021 | $4,129 | $170,688 | $62,068 | $108,620 |
| 2020 | $4,191 | $177,109 | $61,432 | $115,677 |
| 2019 | $3,851 | $173,715 | $60,228 | $113,487 |
| 2018 | $3,785 | $171,308 | $59,047 | $112,261 |
| 2017 | $3,624 | $168,124 | $57,889 | $110,235 |
| 2016 | $3,436 | $165,003 | $56,754 | $108,249 |
| 2015 | $3,524 | $170,891 | $55,902 | $114,989 |
| 2014 | $3,432 | $165,118 | $54,807 | $110,311 |
Source: Public Records
Map
Nearby Homes
Your Personal Tour Guide
Ask me questions while you tour the home.