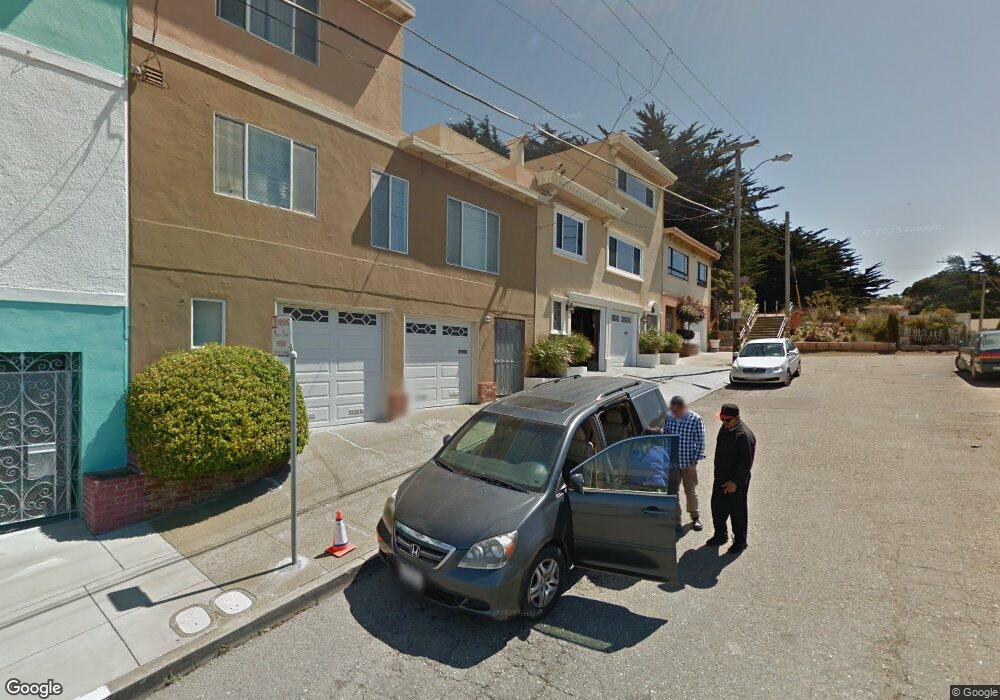
1015 Excelsior Ave San Francisco, CA 94112
Excelsior NeighborhoodEstimated Value: $920,000 - $1,155,000
--
Bed
2
Baths
1,422
Sq Ft
$707/Sq Ft
Est. Value
About This Home
This home is located at 1015 Excelsior Ave, San Francisco, CA 94112 and is currently estimated at $1,004,872, approximately $706 per square foot. 1015 Excelsior Ave is a home located in San Francisco County with nearby schools including Hillcrest Elementary School, King Jr. (Martin Luther) Academic Middle School, and Golden Bridges School.
Ownership History
Date
Name
Owned For
Owner Type
Purchase Details
Closed on
Jan 14, 2003
Sold by
Mayorga Ines and Dominguez Denis A
Bought by
Mayorga Edgar A and Mayorga Ines
Current Estimated Value
Home Financials for this Owner
Home Financials are based on the most recent Mortgage that was taken out on this home.
Original Mortgage
$300,000
Outstanding Balance
$127,424
Interest Rate
5.96%
Mortgage Type
Stand Alone First
Estimated Equity
$877,448
Purchase Details
Closed on
Jul 8, 1994
Sold by
Mayorga Edgar and Mayorga Inez
Bought by
Mayorga Inez and Dominguez Denis A
Create a Home Valuation Report for This Property
The Home Valuation Report is an in-depth analysis detailing your home's value as well as a comparison with similar homes in the area
Home Values in the Area
Average Home Value in this Area
Purchase History
| Date | Buyer | Sale Price | Title Company |
|---|---|---|---|
| Mayorga Edgar A | -- | Chicago Title Company | |
| Mayorga Inez | -- | -- |
Source: Public Records
Mortgage History
| Date | Status | Borrower | Loan Amount |
|---|---|---|---|
| Open | Mayorga Edgar A | $300,000 |
Source: Public Records
Tax History Compared to Growth
Tax History
| Year | Tax Paid | Tax Assessment Tax Assessment Total Assessment is a certain percentage of the fair market value that is determined by local assessors to be the total taxable value of land and additions on the property. | Land | Improvement |
|---|---|---|---|---|
| 2025 | $4,821 | $417,248 | $176,796 | $240,452 |
| 2024 | $4,821 | $409,068 | $173,330 | $235,738 |
| 2023 | $4,752 | $401,048 | $169,932 | $231,116 |
| 2022 | $4,667 | $393,186 | $166,600 | $226,586 |
| 2021 | $5,189 | $385,478 | $163,334 | $222,144 |
| 2020 | $5,229 | $381,528 | $161,660 | $219,868 |
| 2019 | $5,052 | $374,050 | $158,492 | $215,558 |
| 2018 | $4,882 | $366,718 | $155,386 | $211,332 |
| 2017 | $4,525 | $359,530 | $152,340 | $207,190 |
| 2016 | $4,426 | $352,482 | $149,354 | $203,128 |
| 2015 | $4,368 | $347,190 | $147,112 | $200,078 |
| 2014 | $4,253 | $340,392 | $144,232 | $196,160 |
Source: Public Records
Map
Nearby Homes