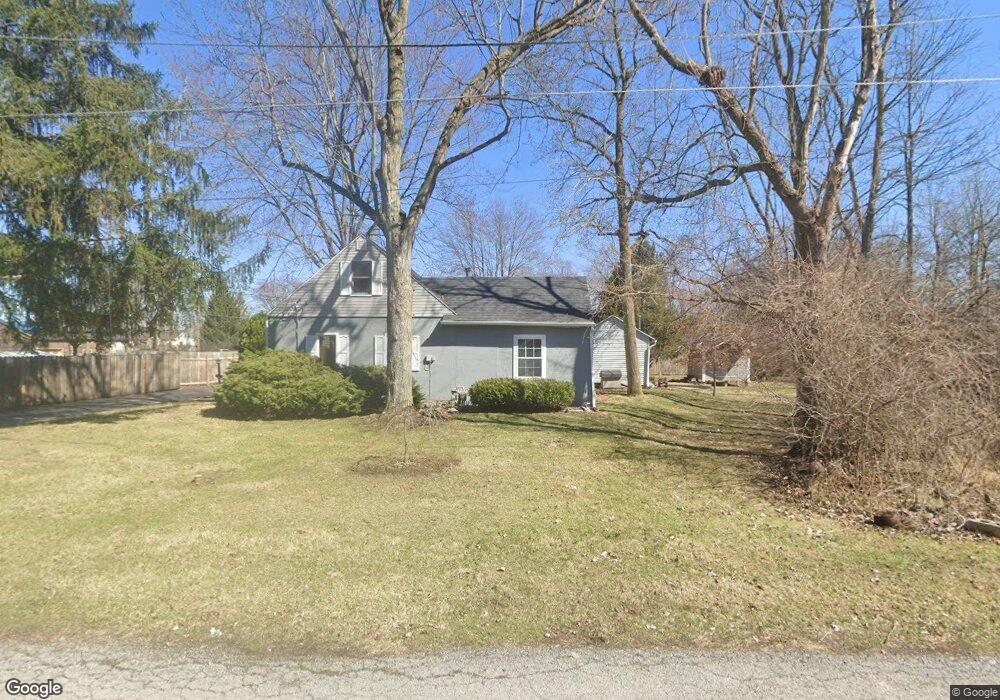
1015 Fremont Ave Findlay, OH 45840
Estimated Value: $127,000 - $153,000
1
Bed
1
Bath
1,020
Sq Ft
$138/Sq Ft
Est. Value
About This Home
This home is located at 1015 Fremont Ave, Findlay, OH 45840 and is currently estimated at $140,866, approximately $138 per square foot. 1015 Fremont Ave is a home located in Hancock County with nearby schools including Whittier Elementary School, Wilson Vance Elementary School, and Donnell Middle School.
Ownership History
Date
Name
Owned For
Owner Type
Purchase Details
Closed on
Apr 6, 1990
Bought by
Courtney Christopher and Yantis Conni
Current Estimated Value
Purchase Details
Closed on
Jul 18, 1988
Bought by
Trice John E and Trice Cynthia E
Purchase Details
Closed on
Aug 3, 1983
Bought by
Trice Jack and Trice Deanna
Create a Home Valuation Report for This Property
The Home Valuation Report is an in-depth analysis detailing your home's value as well as a comparison with similar homes in the area
Home Values in the Area
Average Home Value in this Area
Purchase History
| Date | Buyer | Sale Price | Title Company |
|---|---|---|---|
| Courtney Christopher | $33,900 | -- | |
| Trice John E | -- | -- | |
| Trice Jack | $25,000 | -- |
Source: Public Records
Tax History Compared to Growth
Tax History
| Year | Tax Paid | Tax Assessment Tax Assessment Total Assessment is a certain percentage of the fair market value that is determined by local assessors to be the total taxable value of land and additions on the property. | Land | Improvement |
|---|---|---|---|---|
| 2024 | $1,272 | $35,780 | $6,110 | $29,670 |
| 2023 | $1,274 | $35,780 | $6,110 | $29,670 |
| 2022 | $1,269 | $35,780 | $6,110 | $29,670 |
| 2021 | $1,130 | $27,750 | $6,130 | $21,620 |
| 2020 | $1,130 | $27,750 | $6,130 | $21,620 |
| 2019 | $1,108 | $27,750 | $6,130 | $21,620 |
| 2018 | $981 | $22,510 | $5,570 | $16,940 |
| 2017 | $490 | $22,510 | $5,570 | $16,940 |
| 2016 | $976 | $22,510 | $5,570 | $16,940 |
| 2015 | $777 | $17,760 | $5,570 | $12,190 |
| 2014 | $777 | $17,760 | $5,570 | $12,190 |
| 2012 | $776 | $17,530 | $5,570 | $11,960 |
Source: Public Records
Map
Nearby Homes
- 1006 Selby St
- 904 Morse St
- 1109 Brookside Dr
- 820 Selby St
- 15591 Canadian Way
- 15586 Canadian Way
- 15615 Canadian Way
- 1011 Stall Dr
- 1008 Eastview Dr
- 804 6th St
- 1109 Park St
- 1037 Fishlock Ave
- 1301 Fishlock Ave
- 1200 5th St
- 420 1st St
- 817 Park St
- 1802 Lippincott Ave
- 0 Blanchard Ave
- 619 Fishlock Ave
- 829 Maple Ave
- 1211 Blanchard Ave
- 1201 Blanchard Ave
- 1014 Fremont Ave
- 1008 Fremont Ave
- 1008 Fremont Ave
- 1024 Fremont Ave
- 1217 Blanchard Ave
- 1256 Blanchard Ave
- 1221 Blanchard Ave
- 1212 Blanchard Ave
- 1121 Blanchard Ave
- 1200 Blanchard Ave
- 1038 Selby St
- 1025 Graceland Ave
- 1225 Blanchard Ave
- 1124 Blanchard Ave
- 1030 Selby St
- 1107 Blanchard Ave
- 1120 Blanchard Ave
- 1120 Blanchard Ave