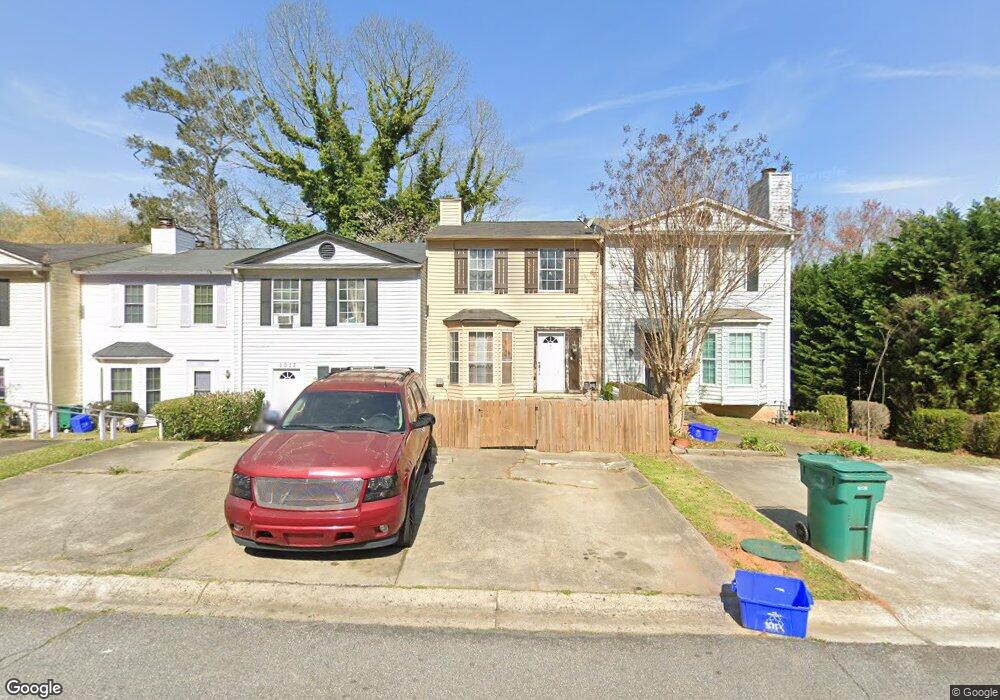
1015 Huntington Trace SE Smyrna, GA 30082
Estimated Value: $227,000 - $264,000
2
Beds
3
Baths
1,292
Sq Ft
$190/Sq Ft
Est. Value
About This Home
This home is located at 1015 Huntington Trace SE, Smyrna, GA 30082 and is currently estimated at $244,860, approximately $189 per square foot. 1015 Huntington Trace SE is a home located in Cobb County with nearby schools including Norton Park Elementary School, Griffin Middle School, and Campbell High School.
Ownership History
Date
Name
Owned For
Owner Type
Purchase Details
Closed on
Feb 27, 2023
Sold by
1015 Huntington Place Llc
Bought by
Guzman Julio Pereira
Current Estimated Value
Purchase Details
Closed on
Nov 28, 2019
Sold by
Mendez Roberto
Bought by
1015 Huntington Place Llc
Purchase Details
Closed on
Jan 8, 2018
Sold by
Malave Marisol
Bought by
Mendez Roberto
Purchase Details
Closed on
Jan 20, 2016
Sold by
Ogbonnaya Osita
Bought by
Pereira Julio Cesar and Malave Marisol
Purchase Details
Closed on
Dec 16, 2011
Sold by
Usa Rental Fund Llc
Bought by
Ogbonnaya Osita
Purchase Details
Closed on
May 13, 2011
Sold by
Cpi Housing Fund Llc
Bought by
Usa Rental Fund Llc
Purchase Details
Closed on
Feb 15, 2011
Sold by
Federal Natl Mtg Assn Fnma
Bought by
Cpi Housing Fund Llc
Purchase Details
Closed on
Aug 3, 2010
Sold by
Bac Hm Lns Svcng Lp
Bought by
Federal Natl Mtg Assn Fnma
Create a Home Valuation Report for This Property
The Home Valuation Report is an in-depth analysis detailing your home's value as well as a comparison with similar homes in the area
Home Values in the Area
Average Home Value in this Area
Purchase History
| Date | Buyer | Sale Price | Title Company |
|---|---|---|---|
| Guzman Julio Pereira | -- | None Listed On Document | |
| 1015 Huntington Place Llc | -- | -- | |
| Mendez Roberto | -- | -- | |
| Pereira Julio Cesar | $65,000 | -- | |
| Ogbonnaya Osita | $33,000 | -- | |
| Usa Rental Fund Llc | -- | -- | |
| Cpi Housing Fund Llc | $6,000 | -- | |
| Federal Natl Mtg Assn Fnma | -- | -- | |
| Bac Hm Lns Svcng Lp | $93,596 | -- |
Source: Public Records
Tax History Compared to Growth
Tax History
| Year | Tax Paid | Tax Assessment Tax Assessment Total Assessment is a certain percentage of the fair market value that is determined by local assessors to be the total taxable value of land and additions on the property. | Land | Improvement |
|---|---|---|---|---|
| 2025 | $2,597 | $95,616 | $18,000 | $77,616 |
| 2024 | $2,597 | $95,616 | $18,000 | $77,616 |
| 2023 | $2,597 | $95,616 | $18,000 | $77,616 |
| 2022 | $2,195 | $80,240 | $10,000 | $70,240 |
| 2021 | $1,705 | $62,012 | $10,000 | $52,012 |
| 2020 | $1,484 | $53,996 | $10,000 | $43,996 |
| 2019 | $1,484 | $53,996 | $10,000 | $43,996 |
| 2018 | $1,205 | $43,820 | $10,000 | $33,820 |
| 2017 | $671 | $26,000 | $3,160 | $22,840 |
| 2016 | $773 | $29,972 | $4,000 | $25,972 |
| 2015 | $791 | $29,972 | $4,000 | $25,972 |
| 2014 | $542 | $20,328 | $0 | $0 |
Source: Public Records
Map
Nearby Homes
- 1028 Huntington Trace SE
- 1084 Huntington Trace SE
- 1090 Huntington Trace SE
- 1104 Huntington Trace SE
- 576 Cresentry Brook
- 273 Aventine Ln
- 3244 Hampton Ct SE
- 3288 Old Concord Rd SE Unit 1
- 3313 Hidden Trail Rd SE
- 3375 Emerson St SE
- 3117 Reeves St SE
- 629 Dunton Cir SE
- 3142 Reeves St SE
- 1007 Oaks Pkwy SE
- 3462 S Sherwood Rd SE
- 358 Nature Brook Walk SE
- 2880 Sherwood Rd SE
- 1017 Huntington Trace SE
- 1013 Huntington Trace SE
- 1019 Huntington Trace SE
- 1021 Huntington Trace SE
- 1011 Huntington Trace SE
- 1023 Huntington Trace SE
- 1009 Huntington Trace SE
- 1007 Huntington Trace SE
- 1007 Huntington Trace SE Unit 1007
- 0 Huntington Trace SE Unit 7539875
- 0 Huntington Trace SE Unit 7392335
- 1005 Huntington Trace SE
- 1003 Huntington Trace SE
- 1003 Huntington Trace SE Unit 55
- 1056 Huntington Trace SE
- 1056 Huntington Trace SE Unit 1506
- 1056 Huntington Trace SE Unit 1056
- 1052 Huntington Trace SE
- 1024 Huntington Trace SE
- 1054 Huntington Trace SE