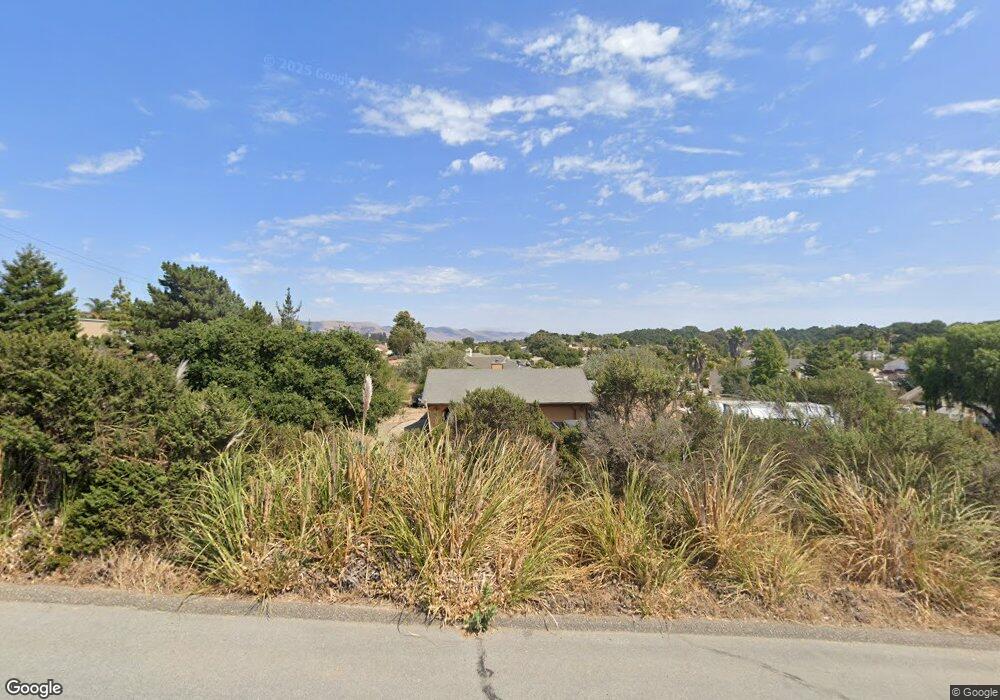
1015 La Serenata Way Nipomo, CA 93444
Estimated Value: $880,591 - $1,011,000
3
Beds
2
Baths
1,574
Sq Ft
$602/Sq Ft
Est. Value
About This Home
This home is located at 1015 La Serenata Way, Nipomo, CA 93444 and is currently estimated at $947,648, approximately $602 per square foot. 1015 La Serenata Way is a home located in San Luis Obispo County with nearby schools including Dana Elementary School, Mesa Middle School, and Nipomo High School.
Ownership History
Date
Name
Owned For
Owner Type
Purchase Details
Closed on
Dec 12, 2018
Sold by
Riptide 102 Llc
Bought by
Judy Thomas and Densmore-Judy Jill
Current Estimated Value
Purchase Details
Closed on
Jul 16, 2007
Sold by
Judy Thomas Cason and Judy Jill Densmore
Bought by
Riptide 102 Llc
Purchase Details
Closed on
Aug 6, 1998
Sold by
Morris Michael R
Bought by
Judy Thomas Cason and Judy Jill Densmore
Home Financials for this Owner
Home Financials are based on the most recent Mortgage that was taken out on this home.
Original Mortgage
$176,000
Interest Rate
6.91%
Purchase Details
Closed on
Apr 14, 1995
Sold by
Fairbrother Russell Edwin
Bought by
Morris Michael R
Purchase Details
Closed on
Feb 22, 1995
Sold by
Fairbrother Russell Edwin and Fairbrother Randi T
Bought by
Boneso Dino A and Boneso Sandra A
Create a Home Valuation Report for This Property
The Home Valuation Report is an in-depth analysis detailing your home's value as well as a comparison with similar homes in the area
Home Values in the Area
Average Home Value in this Area
Purchase History
| Date | Buyer | Sale Price | Title Company |
|---|---|---|---|
| Judy Thomas | -- | None Available | |
| Riptide 102 Llc | -- | None Available | |
| Judy Thomas Cason | $220,000 | Fidelity National Title Co | |
| Morris Michael R | -- | Chicago Title Company | |
| Boneso Dino A | -- | Chicago Title Company |
Source: Public Records
Mortgage History
| Date | Status | Borrower | Loan Amount |
|---|---|---|---|
| Previous Owner | Judy Thomas Cason | $176,000 | |
| Closed | Judy Thomas Cason | $22,000 |
Source: Public Records
Tax History Compared to Growth
Tax History
| Year | Tax Paid | Tax Assessment Tax Assessment Total Assessment is a certain percentage of the fair market value that is determined by local assessors to be the total taxable value of land and additions on the property. | Land | Improvement |
|---|---|---|---|---|
| 2025 | $3,547 | $344,866 | $172,433 | $172,433 |
| 2024 | $3,507 | $338,104 | $169,052 | $169,052 |
| 2023 | $3,507 | $331,476 | $165,738 | $165,738 |
| 2022 | $3,454 | $324,978 | $162,489 | $162,489 |
| 2021 | $3,447 | $318,606 | $159,303 | $159,303 |
| 2020 | $3,408 | $315,340 | $157,670 | $157,670 |
| 2019 | $3,387 | $309,158 | $154,579 | $154,579 |
| 2018 | $3,347 | $303,098 | $151,549 | $151,549 |
| 2017 | $3,284 | $297,156 | $148,578 | $148,578 |
| 2016 | $3,097 | $291,330 | $145,665 | $145,665 |
| 2015 | $3,053 | $286,954 | $143,477 | $143,477 |
| 2014 | $2,940 | $281,334 | $140,667 | $140,667 |
Source: Public Records
Map
Nearby Homes
- 620 Camino Roble
- 615 Sweet Donna Place
- 1010 1012 Upper Los Berros Rd
- 7855 Suey Creek Rd
- 875 Camino Caballo
- 219 Lema Dr
- 940 Calle Fresa
- 217 Hope Way
- 231 Trevino Dr
- 228 Chaparral Ln
- 255 Encino Ln
- 759 Viola Ct
- 261 Hazel Ln
- 719 W Tefft St
- 1225 Dawn Rd
- 161 Lot Scenic View Way
- 0 Scenic View Way
- 680 Hill St
- 1060 Dawn Rd
- 1150 Redberry Place
- 1017 La Serenata Way
- 1010 La Serenata Way
- 1035 La Serenata Way
- 1019 La Serenata Way
- 1020 La Serenata Way
- 939 Camino Caballo
- 996 Silver Dollar Ln
- 1030 La Serenata Way
- 985 Silver Dollar Ln
- 1020 Camino Codorniz
- 994 Red Gum Ln
- 1045 La Serenata Way
- 1040 La Serenata Way
- 988 Silver Dollar Ln
- 680 Sweet Donna Place
- 986 Red Gum Ln Unit 12
- 986 Red Gum Ln
- 975 Silver Dollar Ln
- 1015 Olympic Way