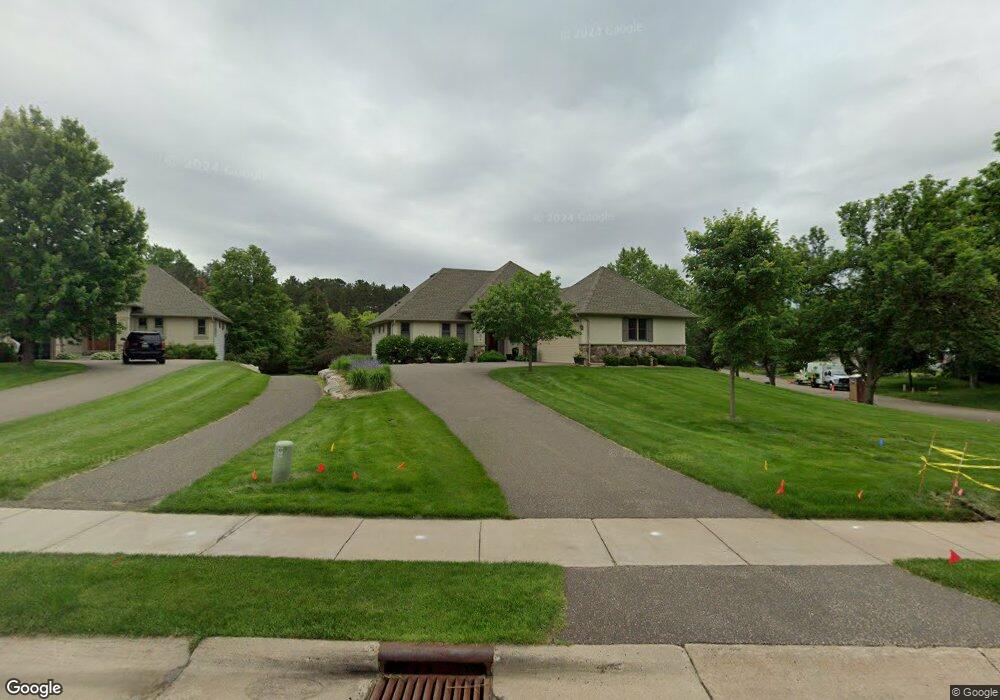
1015 Nena Dr Stillwater, MN 55082
Estimated Value: $606,000 - $703,000
3
Beds
3
Baths
1,712
Sq Ft
$379/Sq Ft
Est. Value
About This Home
This home is located at 1015 Nena Dr, Stillwater, MN 55082 and is currently estimated at $648,476, approximately $378 per square foot. 1015 Nena Dr is a home located in Washington County with nearby schools including Stonebridge Elementary School, Stillwater Middle School, and Stillwater Area High School.
Ownership History
Date
Name
Owned For
Owner Type
Purchase Details
Closed on
Aug 26, 2019
Sold by
Macdonald Jean Scheuerman and Macdonald Jean Scheuerman
Bought by
Butala Mark J and Butala Nancy J
Current Estimated Value
Home Financials for this Owner
Home Financials are based on the most recent Mortgage that was taken out on this home.
Original Mortgage
$438,400
Outstanding Balance
$384,789
Interest Rate
3.7%
Mortgage Type
New Conventional
Estimated Equity
$263,687
Purchase Details
Closed on
Sep 7, 2018
Sold by
Macdonald Jean Scheuerman and Macdonald Daniel J
Bought by
Macdonald Jean Scheuerman and Macdonald Daniel J
Purchase Details
Closed on
May 9, 2012
Sold by
Thorbus Robert E
Bought by
Macdonald Daniel J and Macodonald Jean Scheuerman
Purchase Details
Closed on
Dec 9, 2002
Sold by
Leoran Corp
Bought by
Morbus Robert E and Morbus Joan P
Purchase Details
Closed on
Nov 27, 2002
Sold by
Amundson Place Development Llc
Bought by
Legran Homes Corp
Create a Home Valuation Report for This Property
The Home Valuation Report is an in-depth analysis detailing your home's value as well as a comparison with similar homes in the area
Home Values in the Area
Average Home Value in this Area
Purchase History
| Date | Buyer | Sale Price | Title Company |
|---|---|---|---|
| Butala Mark J | $274,000 | None Available | |
| Butala Mark J | $274,000 | None Available | |
| Macdonald Jean Scheuerman | -- | None Available | |
| Macdonald Daniel J | $423,200 | None Available | |
| Morbus Robert E | $95,000 | -- | |
| Legran Homes Corp | $85,000 | -- |
Source: Public Records
Mortgage History
| Date | Status | Borrower | Loan Amount |
|---|---|---|---|
| Open | Butala Mark J | $438,400 |
Source: Public Records
Tax History Compared to Growth
Tax History
| Year | Tax Paid | Tax Assessment Tax Assessment Total Assessment is a certain percentage of the fair market value that is determined by local assessors to be the total taxable value of land and additions on the property. | Land | Improvement |
|---|---|---|---|---|
| 2024 | $7,876 | $644,200 | $140,000 | $504,200 |
| 2023 | $7,876 | $644,300 | $152,800 | $491,500 |
| 2022 | $6,174 | $604,400 | $152,800 | $451,600 |
| 2021 | $5,776 | $514,300 | $130,000 | $384,300 |
| 2020 | $5,818 | $499,500 | $125,000 | $374,500 |
| 2019 | $5,780 | $496,500 | $115,000 | $381,500 |
| 2018 | $5,874 | $466,900 | $110,000 | $356,900 |
| 2017 | $5,398 | $473,900 | $110,000 | $363,900 |
| 2016 | $5,310 | $415,900 | $90,000 | $325,900 |
| 2015 | $5,364 | $417,600 | $100,000 | $317,600 |
| 2013 | -- | $367,600 | $62,900 | $304,700 |
Source: Public Records
Map
Nearby Homes
- 918 William St N
- 1347 McKusick Road Ln N
- 610 Wilkins St W
- 1311 Meadowlark Dr
- 1504 Linden St W
- 855 Eagle Ridge Ln
- 809 5th St N
- 212 Birchwood Dr N
- 1110 Lecuyer Dr
- 451 Everett St N
- 406 Mulberry St W
- 620 Main St N Unit 114
- 640 Main St N Unit 42
- 640 Main St N Unit 37
- 610 Main St N Unit 305
- 211 Olive St W
- 501 Main St N Unit 202
- 501 Main St N Unit 222
- 1824 1st St N
- 950 Owens St N
- 1015 Nena Dr
- 1025 Nena Dr
- 995 Amundson Dr
- 975 Amundson Dr
- 1045 Nena Ct
- 1020 Amundson Dr
- 1020 Nena Dr
- 1040 Amundson Dr
- 1030 Nena Dr
- 960 Amundson Dr
- 955 Amundson Dr
- 1055 Amundson Dr
- 1065 Nena Ct
- 1060 Amundson Dr
- 940 Amundson Dr
- 935 Amundson Dr
- 1075 Amundson Dr
- 1100 Nena Dr
- 915 Amundson Dr
- 1085 Nena Ct