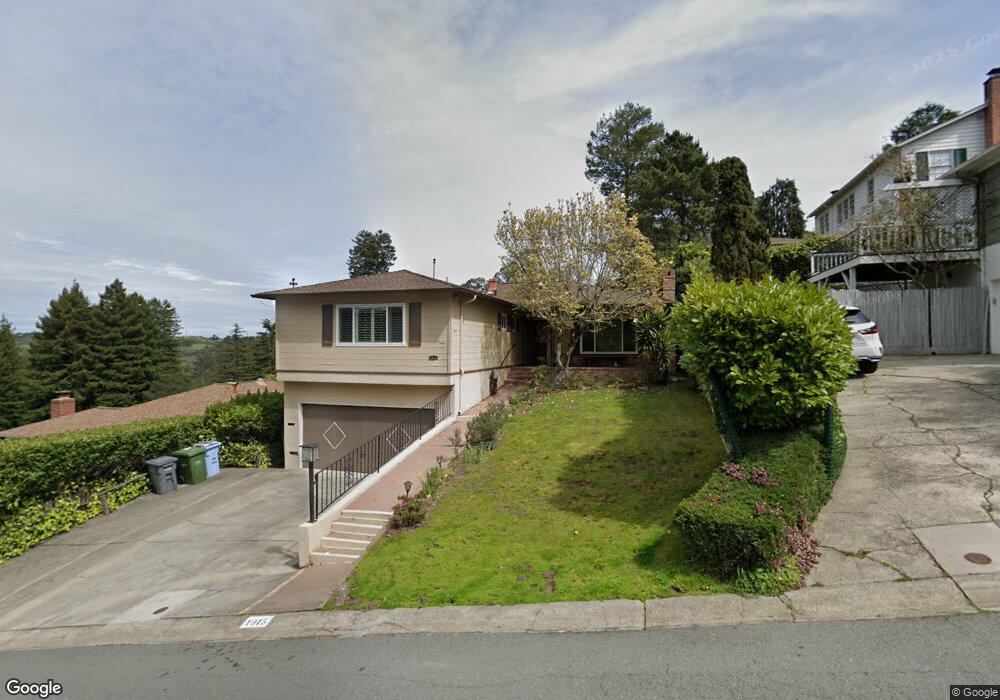
1015 Park Hills Rd Berkeley, CA 94708
Berkeley Hills NeighborhoodEstimated Value: $1,242,000 - $1,592,000
3
Beds
2
Baths
1,465
Sq Ft
$954/Sq Ft
Est. Value
About This Home
This home is located at 1015 Park Hills Rd, Berkeley, CA 94708 and is currently estimated at $1,397,015, approximately $953 per square foot. 1015 Park Hills Rd is a home located in Alameda County with nearby schools including Cragmont Elementary School, Berkeley Arts Magnet at Whittier School, and Washington Elementary School.
Ownership History
Date
Name
Owned For
Owner Type
Purchase Details
Closed on
Jan 15, 2013
Sold by
Pincus Sharon Ziona
Bought by
Pincus Sharon Ziona and Sharon Ziona Pincus Living Tru
Current Estimated Value
Home Financials for this Owner
Home Financials are based on the most recent Mortgage that was taken out on this home.
Original Mortgage
$404,000
Interest Rate
3.5%
Mortgage Type
New Conventional
Purchase Details
Closed on
Jul 6, 2012
Sold by
Pincus Sharon Ziona
Bought by
Pincus Sharon Ziona and Sharon Ziona Pincus Living Tru
Home Financials for this Owner
Home Financials are based on the most recent Mortgage that was taken out on this home.
Original Mortgage
$406,800
Interest Rate
3.49%
Mortgage Type
New Conventional
Purchase Details
Closed on
Nov 11, 2010
Sold by
Pincus Sharon Z
Bought by
Pincus Sharon Ziona and The Sharon Ziona Pincus Living
Home Financials for this Owner
Home Financials are based on the most recent Mortgage that was taken out on this home.
Original Mortgage
$416,000
Interest Rate
4.23%
Mortgage Type
New Conventional
Purchase Details
Closed on
Feb 22, 2010
Sold by
Pincus Sharon Ziona
Bought by
Pincus Sharon Ziona and The Sharon Ziona Pincus Living
Home Financials for this Owner
Home Financials are based on the most recent Mortgage that was taken out on this home.
Original Mortgage
$417,000
Interest Rate
5.03%
Mortgage Type
New Conventional
Purchase Details
Closed on
Dec 6, 2005
Sold by
Pincus Sharon Ziona
Bought by
Pincus Sharon Ziona and Sharon Ziona Pincus Living Tru
Purchase Details
Closed on
Feb 27, 2004
Sold by
Pincus Michael
Bought by
Pincus Sharon Ziona
Home Financials for this Owner
Home Financials are based on the most recent Mortgage that was taken out on this home.
Original Mortgage
$460,000
Interest Rate
5.61%
Mortgage Type
New Conventional
Create a Home Valuation Report for This Property
The Home Valuation Report is an in-depth analysis detailing your home's value as well as a comparison with similar homes in the area
Home Values in the Area
Average Home Value in this Area
Purchase History
| Date | Buyer | Sale Price | Title Company |
|---|---|---|---|
| Pincus Sharon Ziona | -- | None Available | |
| Pincus Sharon Ziona | -- | First American Title Company | |
| Pincus Sharon Ziona | -- | None Available | |
| Pincus Sharon Ziona | -- | None Available | |
| Pincus Sharon Ziona | -- | None Available | |
| Pincus Sharon Z | -- | None Available | |
| Pincus Sharon Ziona | -- | None Available | |
| Pincus Sharon Ziona | -- | None Available | |
| Pincus Sharon Ziona | -- | -- | |
| Pincus Sharon Ziona | -- | Commonwealth Land Title Co |
Source: Public Records
Mortgage History
| Date | Status | Borrower | Loan Amount |
|---|---|---|---|
| Previous Owner | Pincus Sharon Ziona | $404,000 | |
| Previous Owner | Pincus Sharon Ziona | $406,800 | |
| Previous Owner | Pincus Sharon Z | $416,000 | |
| Previous Owner | Pincus Sharon Ziona | $417,000 | |
| Previous Owner | Pincus Sharon Ziona | $460,000 |
Source: Public Records
Tax History
| Year | Tax Paid | Tax Assessment Tax Assessment Total Assessment is a certain percentage of the fair market value that is determined by local assessors to be the total taxable value of land and additions on the property. | Land | Improvement |
|---|---|---|---|---|
| 2025 | $10,639 | $507,873 | $153,122 | $361,751 |
| 2024 | $10,639 | $497,778 | $150,120 | $354,658 |
| 2023 | $10,344 | $494,881 | $147,176 | $347,705 |
| 2022 | $10,268 | $478,178 | $144,291 | $340,887 |
| 2021 | $10,259 | $468,666 | $141,462 | $334,204 |
| 2020 | $9,659 | $470,790 | $140,012 | $330,778 |
| 2019 | $9,204 | $461,560 | $137,267 | $324,293 |
| 2018 | $8,997 | $452,511 | $134,576 | $317,935 |
| 2017 | $8,670 | $443,639 | $131,937 | $311,702 |
| 2016 | $8,307 | $434,943 | $129,351 | $305,592 |
| 2015 | $8,168 | $428,411 | $127,408 | $301,003 |
| 2014 | $8,011 | $420,021 | $124,913 | $295,108 |
Source: Public Records
Map
Nearby Homes
- 1040 Park Hills Rd
- 1085 Creston Rd
- 1024 Grizzly Peak Blvd
- 935 Grizzly Peak Blvd
- 730 Wildcat Canyon Rd
- 1160 Miller Ave
- 1110 Sterling Ave
- 1155 Keeler Ave
- 1221 Grizzly Peak Blvd
- 1165 Cragmont Ave
- 1106 Cragmont Ave
- 962 Regal Rd
- 1004 Cragmont Ave
- 1375 Queens Rd
- 2686 Shasta Rd
- 777 Cragmont Ave
- 606 Grizzly Peak Blvd
- 938 San Benito Rd
- 758 Spruce St
- 230 Fairlawn Dr
- 1011 Park Hills Rd
- 5 The Crescent
- 1021 Park Hills Rd
- 1007 Park Hills Rd
- 1016 Park Hills Rd
- 11 The Crescent
- 1020 Park Hills Rd
- 3 The Shortcut
- 1003 Park Hills Rd
- 1010 Park Hills Rd
- 1006 Wildcat Canyon Rd
- 2 The Crescent
- 2 the Crescnt
- 1013 Middlefield Rd
- 1015 Middlefield Rd
- 15 the Crescnt
- 1004 Park Hills Rd
- 15 The Crescent
- 1008 Wildcat Canyon Rd
- 1007 Middlefield Rd
Your Personal Tour Guide
Ask me questions while you tour the home.