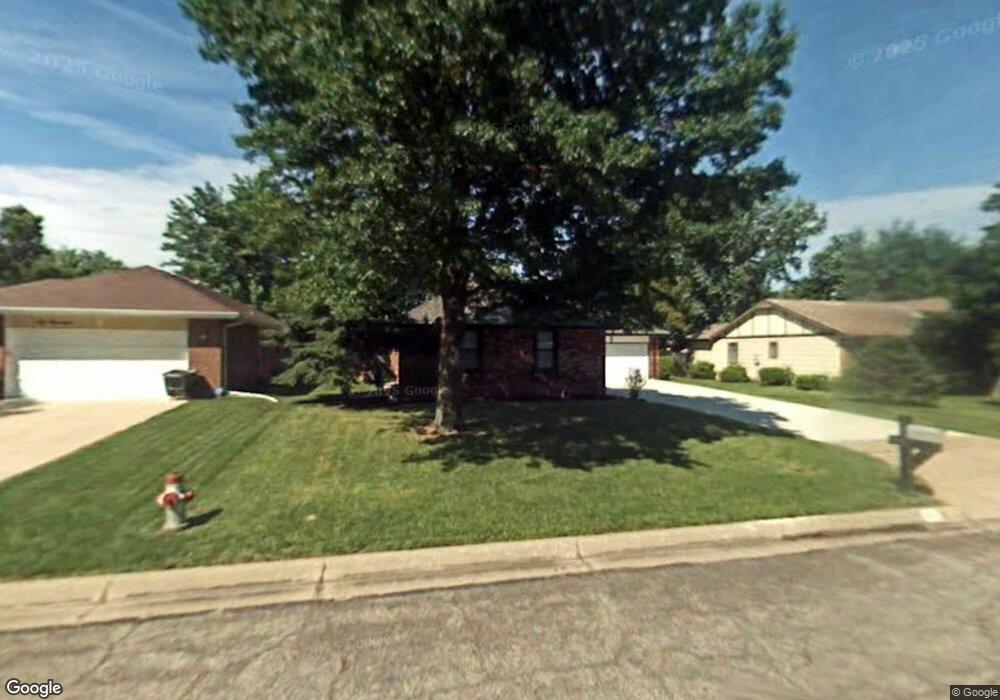
1015 S Cypress St Wichita, KS 67207
Southeast Wichita NeighborhoodEstimated Value: $266,786 - $299,000
4
Beds
3
Baths
2,350
Sq Ft
$120/Sq Ft
Est. Value
About This Home
This home is located at 1015 S Cypress St, Wichita, KS 67207 and is currently estimated at $282,893, approximately $120 per square foot. 1015 S Cypress St is a home located in Sedgwick County with nearby schools including Beech Elementary School, Curtis Middle School, and Wichita Southeast High School.
Ownership History
Date
Name
Owned For
Owner Type
Purchase Details
Closed on
Oct 12, 2023
Sold by
Leone Raymond
Bought by
Gudd2go Properties Llc
Current Estimated Value
Purchase Details
Closed on
Mar 3, 2021
Sold by
Duarte Joseph and Marylou Abrams Revocable Trust
Bought by
Melton Mark L and Melton Kristel
Home Financials for this Owner
Home Financials are based on the most recent Mortgage that was taken out on this home.
Original Mortgage
$104,500
Interest Rate
2.7%
Mortgage Type
New Conventional
Purchase Details
Closed on
Jan 6, 2014
Sold by
Abrams Max E and Abrams Marylou
Bought by
Abrams Marylou
Purchase Details
Closed on
Apr 2, 2009
Sold by
Mceuen Larry J and Mceuen Joann
Bought by
Abrams Max E and Abrams Marylou
Purchase Details
Closed on
May 18, 2001
Sold by
Smith Frank A and Smith Levita F
Bought by
Mceuen Larry J and Mceuen Joann
Home Financials for this Owner
Home Financials are based on the most recent Mortgage that was taken out on this home.
Original Mortgage
$97,650
Interest Rate
6.99%
Create a Home Valuation Report for This Property
The Home Valuation Report is an in-depth analysis detailing your home's value as well as a comparison with similar homes in the area
Home Values in the Area
Average Home Value in this Area
Purchase History
| Date | Buyer | Sale Price | Title Company |
|---|---|---|---|
| Gudd2go Properties Llc | -- | Security 1St Title | |
| Melton Mark L | -- | Security 1St Title Llc | |
| Abrams Marylou | -- | None Available | |
| Abrams Max E | -- | 1St Am | |
| Mceuen Larry J | -- | Security Abstract & Title Co |
Source: Public Records
Mortgage History
| Date | Status | Borrower | Loan Amount |
|---|---|---|---|
| Previous Owner | Melton Mark L | $104,500 | |
| Previous Owner | Mceuen Larry J | $97,650 |
Source: Public Records
Tax History Compared to Growth
Tax History
| Year | Tax Paid | Tax Assessment Tax Assessment Total Assessment is a certain percentage of the fair market value that is determined by local assessors to be the total taxable value of land and additions on the property. | Land | Improvement |
|---|---|---|---|---|
| 2025 | $2,357 | $28,178 | $5,141 | $23,037 |
| 2023 | $2,357 | $20,160 | $2,346 | $17,814 |
| 2022 | $2,068 | $18,688 | $2,220 | $16,468 |
| 2021 | $2,010 | $17,630 | $2,220 | $15,410 |
| 2020 | $1,901 | $16,630 | $2,220 | $14,410 |
| 2019 | $1,760 | $15,399 | $2,220 | $13,179 |
| 2018 | $1,679 | $14,663 | $1,484 | $13,179 |
| 2017 | $1,614 | $0 | $0 | $0 |
| 2016 | $1,563 | $0 | $0 | $0 |
| 2015 | $1,551 | $0 | $0 | $0 |
| 2014 | $1,519 | $0 | $0 | $0 |
Source: Public Records
Map
Nearby Homes
- 1009 S Cypress St
- 949 S Laurel St
- 1025 S Burrus Ct
- 1034 S Dalton Dr
- 1017 S Dalton Dr
- 1009 S Dalton Dr
- 1044 S Beech St
- 1450 S Webb Rd
- 1717 S Cypress St
- 8419 E Harry St
- 1202 S Stoneybrook Cir
- 802 S Eastmoor St
- 8319 E Indianapolis St
- 8201 E Harry St
- 10011 E Boston St
- 1759 S Webb Rd
- Esperanza Plan at Buena Vista
- Ibiza Plan at Buena Vista
- Luciana Plan at Buena Vista
- Medina Plan at Buena Vista
- 1015 S Cypress Dr
- 1019 S Cypress St
- 1025 S Cypress St
- 1024 S Breckenridge Ct
- 1001 S Cypress St
- 1031 S Cypress St
- 1012 S Cypress St
- 1030 S Breckenridge Ct
- 1020 S Cypress St
- 1020 S Breckenridge Ct
- 1126 S Breckenridge Ct
- 1026 S Cypress St
- 1004 S Cypress St
- 1122 S Breckenridge Ct
- 962 S Cypress St
- 1032 S Cypress St
- 961 S Cypress St
- 1039 S Cypress St
- 1130 S Breckenridge Ct
- 1012 S Breckenridge Ct