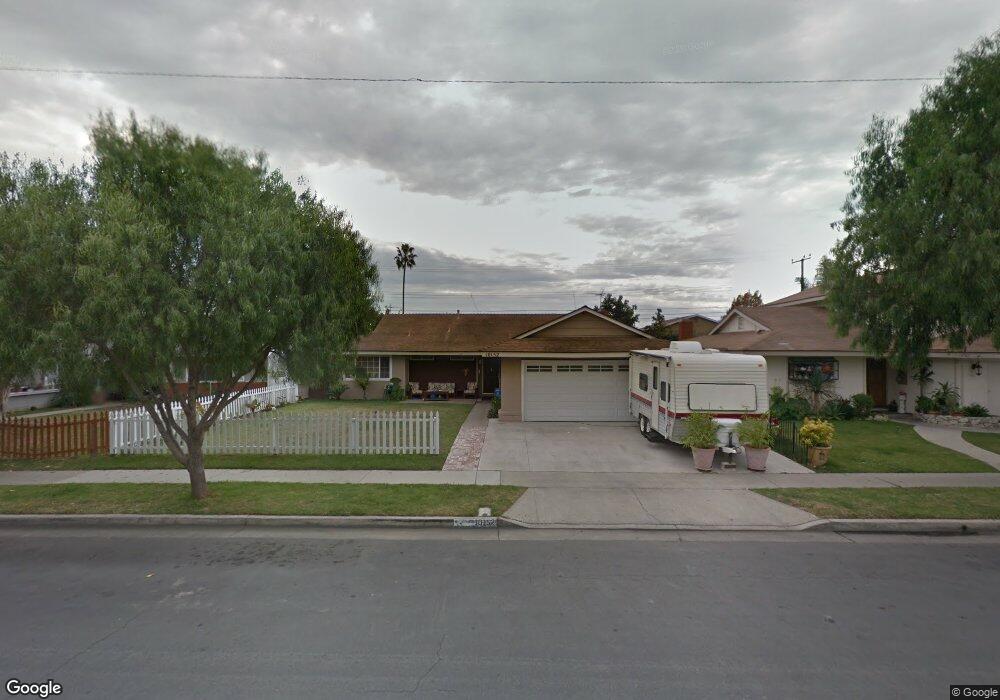
10152 Valley Forge Dr Huntington Beach, CA 92646
Estimated Value: $1,152,175 - $1,342,000
4
Beds
2
Baths
1,458
Sq Ft
$870/Sq Ft
Est. Value
About This Home
This home is located at 10152 Valley Forge Dr, Huntington Beach, CA 92646 and is currently estimated at $1,267,794, approximately $869 per square foot. 10152 Valley Forge Dr is a home located in Orange County with nearby schools including Isojiro Oka Elementary, Talbert Middle School, and Edison High School.
Ownership History
Date
Name
Owned For
Owner Type
Purchase Details
Closed on
Mar 21, 2019
Sold by
Knapp Spencer L
Bought by
Knapp Corum Natalie E
Current Estimated Value
Purchase Details
Closed on
Oct 17, 2005
Sold by
Knapp Spencer L and Knapp Corum Natalie E
Bought by
Knapp Spencer L and Knapp Corum Natalie E
Purchase Details
Closed on
Oct 25, 2003
Sold by
Knapp Spencer L and Knapp Corum Natalie E
Bought by
Knapp Spencer L and Knapp Corum Natalie E
Home Financials for this Owner
Home Financials are based on the most recent Mortgage that was taken out on this home.
Original Mortgage
$142,500
Interest Rate
5.98%
Mortgage Type
Purchase Money Mortgage
Purchase Details
Closed on
Oct 4, 1993
Sold by
Knapp Carolyn Elaine
Bought by
Knapp Spencer L
Home Financials for this Owner
Home Financials are based on the most recent Mortgage that was taken out on this home.
Original Mortgage
$164,800
Interest Rate
6.95%
Create a Home Valuation Report for This Property
The Home Valuation Report is an in-depth analysis detailing your home's value as well as a comparison with similar homes in the area
Home Values in the Area
Average Home Value in this Area
Purchase History
| Date | Buyer | Sale Price | Title Company |
|---|---|---|---|
| Knapp Corum Natalie E | -- | None Available | |
| Knapp Spencer L | -- | -- | |
| Knapp Spencer L | -- | First American Title Ins Co | |
| Knapp Spencer L | -- | Old Republic Title Company | |
| Knapp Spencer L | $206,000 | Old Republic Title Company |
Source: Public Records
Mortgage History
| Date | Status | Borrower | Loan Amount |
|---|---|---|---|
| Closed | Knapp Spencer L | $142,500 | |
| Closed | Knapp Spencer L | $164,800 |
Source: Public Records
Tax History Compared to Growth
Tax History
| Year | Tax Paid | Tax Assessment Tax Assessment Total Assessment is a certain percentage of the fair market value that is determined by local assessors to be the total taxable value of land and additions on the property. | Land | Improvement |
|---|---|---|---|---|
| 2025 | $4,066 | $350,123 | $250,128 | $99,995 |
| 2024 | $4,066 | $343,258 | $245,223 | $98,035 |
| 2023 | $3,968 | $336,528 | $240,415 | $96,113 |
| 2022 | $3,906 | $329,930 | $235,701 | $94,229 |
| 2021 | $3,831 | $323,461 | $231,079 | $92,382 |
| 2020 | $3,807 | $320,145 | $228,710 | $91,435 |
| 2019 | $3,731 | $313,868 | $224,225 | $89,643 |
| 2018 | $3,659 | $307,714 | $219,828 | $87,886 |
| 2017 | $3,600 | $301,681 | $215,518 | $86,163 |
| 2016 | $3,450 | $295,766 | $211,292 | $84,474 |
| 2015 | $3,397 | $291,324 | $208,118 | $83,206 |
| 2014 | $3,328 | $285,618 | $204,041 | $81,577 |
Source: Public Records
Map
Nearby Homes
- 19880 Berkshire Ln
- 19774 Cambridge Ln
- 19922 Carmania Ln
- 19941 Carmania Ln
- 9831 Continental Dr
- 19361 Brookhurst St Unit 159
- 19361 Brookhurst St Unit 87
- 19361 Brookhurst St Unit 50
- 19361 Brookhurst St Unit 143
- 19361 Brookhurst St Unit 21
- 19361 Brookhurst St Unit 22
- 19361 Brookhurst St Unit 184
- 19361 Brookhurst St Unit 33
- 19860 Claremont Ln
- 19843 Coventry Ln
- 19350 Ward St Unit 14
- 19350 Ward St Unit 38
- 19350 Ward St Unit 57
- 9745 Cornwall Dr
- 10151 Kukui Dr
- 10162 Valley Forge Dr
- 10142 Valley Forge Dr
- 10151 Merrimac Dr
- 10141 Merrimac Dr
- 10161 Merrimac Dr
- 10172 Valley Forge Dr
- 10132 Valley Forge Dr
- 10131 Merrimac Dr
- 10171 Merrimac Dr
- 19561 Trenton Ln
- 10141 Valley Forge Dr
- 10182 Valley Forge Dr
- 10122 Valley Forge Dr
- 10131 Valley Forge Dr
- 10121 Merrimac Dr
- 10181 Merrimac Dr
- 19551 Trenton Ln
- 10192 Valley Forge Dr
- 10112 Valley Forge Dr
- 10121 Valley Forge Dr