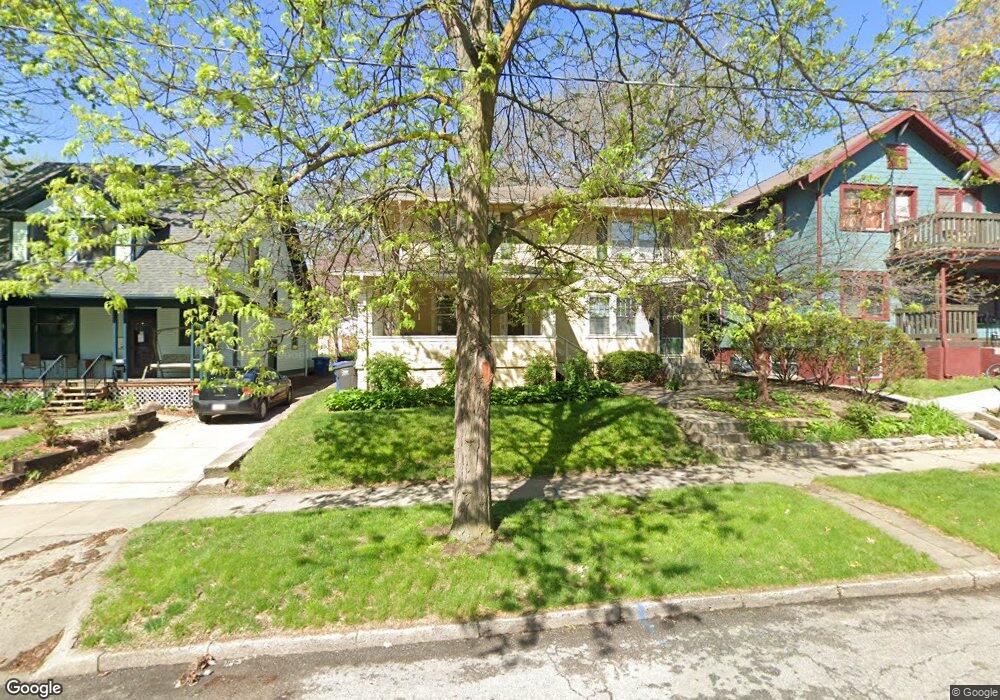
1016 25th St Des Moines, IA 50311
Drake NeighborhoodEstimated Value: $220,000 - $323,000
4
Beds
2
Baths
2,414
Sq Ft
$114/Sq Ft
Est. Value
About This Home
This home is located at 1016 25th St, Des Moines, IA 50311 and is currently estimated at $274,148, approximately $113 per square foot. 1016 25th St is a home located in Polk County with nearby schools including Roosevelt High School.
Ownership History
Date
Name
Owned For
Owner Type
Purchase Details
Closed on
Apr 3, 2020
Sold by
Murray Brian K and Hartman Jeff L
Bought by
Jlh Holdings 1Llc
Current Estimated Value
Purchase Details
Closed on
Apr 15, 1997
Sold by
Miller And Mueller R E Ltd
Bought by
Hartman Jeff
Home Financials for this Owner
Home Financials are based on the most recent Mortgage that was taken out on this home.
Original Mortgage
$29,695
Interest Rate
7.93%
Mortgage Type
Seller Take Back
Create a Home Valuation Report for This Property
The Home Valuation Report is an in-depth analysis detailing your home's value as well as a comparison with similar homes in the area
Home Values in the Area
Average Home Value in this Area
Purchase History
| Date | Buyer | Sale Price | Title Company |
|---|---|---|---|
| Jlh Holdings 1Llc | -- | None Available | |
| Hartman Jeff | $35,500 | -- |
Source: Public Records
Mortgage History
| Date | Status | Borrower | Loan Amount |
|---|---|---|---|
| Previous Owner | Hartman Jeff | $29,695 |
Source: Public Records
Tax History Compared to Growth
Tax History
| Year | Tax Paid | Tax Assessment Tax Assessment Total Assessment is a certain percentage of the fair market value that is determined by local assessors to be the total taxable value of land and additions on the property. | Land | Improvement |
|---|---|---|---|---|
| 2025 | $4,500 | $265,300 | $25,900 | $239,400 |
| 2024 | $4,500 | $228,700 | $22,300 | $206,400 |
| 2023 | $4,118 | $228,700 | $22,300 | $206,400 |
| 2022 | $4,086 | $174,700 | $18,000 | $156,700 |
| 2021 | $3,828 | $174,700 | $18,000 | $156,700 |
| 2020 | $3,976 | $153,400 | $16,000 | $137,400 |
| 2019 | $4,008 | $153,400 | $16,000 | $137,400 |
| 2018 | $3,966 | $149,100 | $11,800 | $137,300 |
| 2017 | $3,656 | $149,100 | $11,800 | $137,300 |
| 2016 | $3,562 | $135,200 | $10,700 | $124,500 |
| 2015 | $3,562 | $135,200 | $10,700 | $124,500 |
| 2014 | $3,406 | $128,200 | $10,100 | $118,100 |
Source: Public Records
Map
Nearby Homes