Estimated Value: $424,000 - $471,000
4
Beds
4
Baths
2,779
Sq Ft
$158/Sq Ft
Est. Value
About This Home
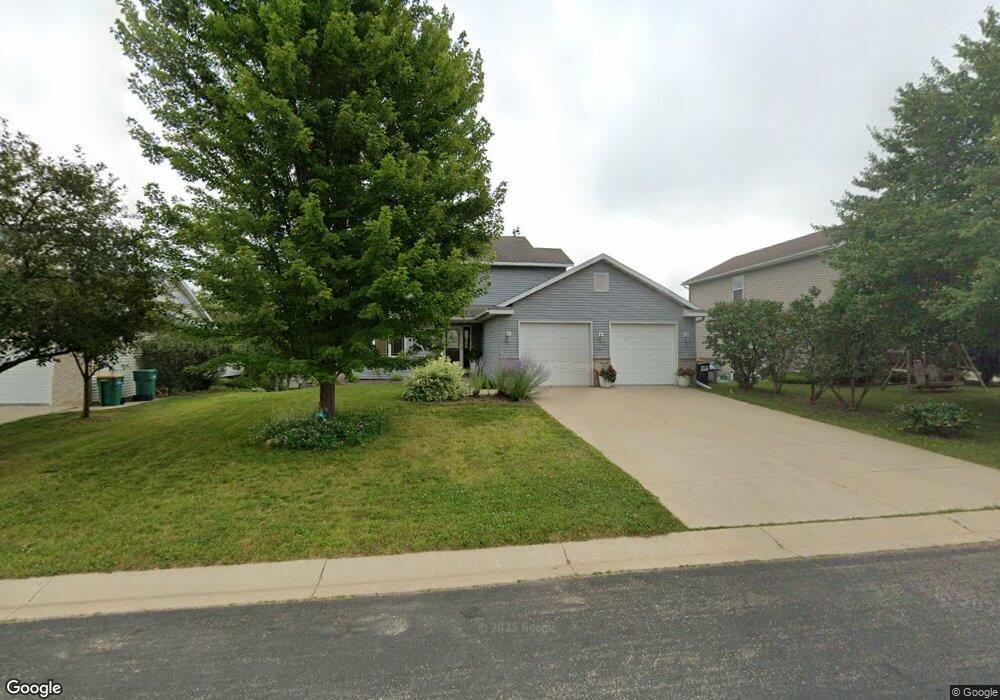
This home is located at 1016 3rd Ave NE, Byron, MN 55920 and is currently estimated at $439,843, approximately $158 per square foot. 1016 3rd Ave NE is a home located in Olmsted County with nearby schools including Byron Intermediate School, Byron Middle School, and Byron Senior High School.
Ownership History
Date
Name
Owned For
Owner Type
Purchase Details
Closed on
Jul 23, 2021
Sold by
Post Justin L and Post Kaylie A
Bought by
Bell Daniel and Lilta Crystal
Current Estimated Value
Home Financials for this Owner
Home Financials are based on the most recent Mortgage that was taken out on this home.
Original Mortgage
$388,500
Outstanding Balance
$353,040
Interest Rate
3%
Mortgage Type
VA
Estimated Equity
$86,803
Purchase Details
Closed on
Jul 23, 2020
Sold by
Ochocki Jason and Ochocki Jennie
Bought by
Post Justin L and Post Kaylie A
Home Financials for this Owner
Home Financials are based on the most recent Mortgage that was taken out on this home.
Original Mortgage
$258,920
Interest Rate
3.1%
Mortgage Type
New Conventional
Create a Home Valuation Report for This Property
The Home Valuation Report is an in-depth analysis detailing your home's value as well as a comparison with similar homes in the area
Home Values in the Area
Average Home Value in this Area
Purchase History
| Date | Buyer | Sale Price | Title Company |
|---|---|---|---|
| Bell Daniel | $375,000 | Rochester Title & Escrow Co | |
| Post Justin L | $323,900 | Rochesrochter Title | |
| Bell Daniel Daniel | $375,000 | -- |
Source: Public Records
Mortgage History
| Date | Status | Borrower | Loan Amount |
|---|---|---|---|
| Open | Bell Daniel | $388,500 | |
| Previous Owner | Post Justin L | $258,920 | |
| Closed | Bell Daniel Daniel | $375,000 |
Source: Public Records
Tax History
| Year | Tax Paid | Tax Assessment Tax Assessment Total Assessment is a certain percentage of the fair market value that is determined by local assessors to be the total taxable value of land and additions on the property. | Land | Improvement |
|---|---|---|---|---|
| 2024 | $6,130 | $389,600 | $55,000 | $334,600 |
| 2023 | $6,072 | $386,400 | $55,000 | $331,400 |
| 2022 | $5,872 | $369,400 | $55,000 | $314,400 |
| 2021 | $4,980 | $320,100 | $55,000 | $265,100 |
| 2020 | $4,782 | $298,500 | $55,000 | $243,500 |
| 2019 | $4,370 | $281,100 | $45,000 | $236,100 |
| 2018 | $4,173 | $260,100 | $40,000 | $220,100 |
| 2017 | $4,126 | $248,300 | $35,000 | $213,300 |
| 2016 | $3,802 | $233,400 | $32,900 | $200,500 |
| 2015 | $3,698 | $209,700 | $32,400 | $177,300 |
| 2014 | $3,192 | $211,700 | $32,400 | $179,300 |
| 2012 | -- | $196,200 | $32,059 | $164,141 |
Source: Public Records
Map
Nearby Homes
- 578 Somerby Pkwy NE
- 595 Somerby Pkwy NE
- 843 Somerby Pkwy NE
- 827 Somerby Pkwy NE
- 805 Somerby Pkwy NE
- 516 Somerby Pkwy NE
- 498 Somerby Pkwy NE
- 1406 Epperstone Enclave NE
- 655 Somerby Pkwy NE
- 667 Somerby Pkwy NE
- 675 Somerby Pkwy NE
- 1413 Epperstone Enclave NE
- 1502 Epperstone Enclave
- 813 Bridgeford Place NE
- 785 Somerby Pkwy NE
- 817 Bridgeford Place NE
- 1400 Delamere Dr NE
- 720 Somerby Pkwy NE
- 843 Bridgeford Place NE
- 1422 Delamere Dr NE
- 1012 3rd Ave NE
- 1102 3rd Ave NE
- 1017 4th Ave NE
- 1017 1017 4th-Avenue-ne
- 1104 1104 3rd-Avenue-ne
- 1104 3rd Ave NE
- 1101 4th Ave NE
- 1013 4th Ave NE
- 1103 1103 4th-Avenue-ne
- 1017 3rd Ave NE
- 1013 3rd Ave NE
- 1101 3rd Ave NE
- 1106 3rd Ave NE
- 1009 4th Ave NE
- 1103 1103 3rd-Avenue-ne
- 1103 3rd Ave NE
- 304 13th St NE
- 1105 3rd Ave NE
- 1016 4th Ave NE
- 1012 4th Ave NE
Your Personal Tour Guide
Ask me questions while you tour the home.