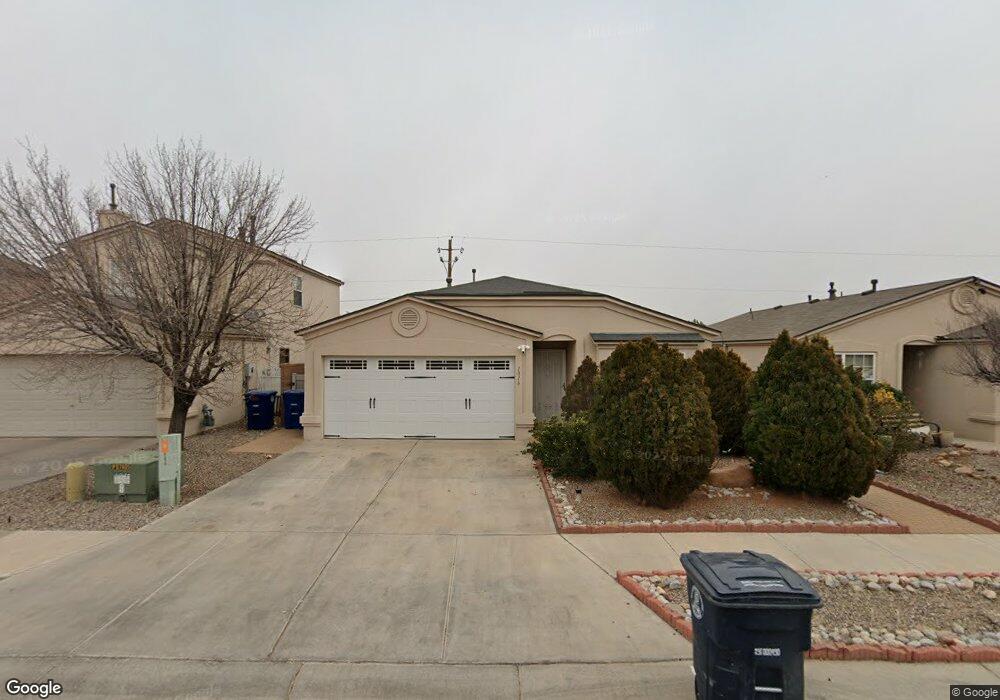
1016 Cassandra St SW Albuquerque, NM 87121
Southwest Heights NeighborhoodEstimated Value: $251,000 - $277,335
3
Beds
2
Baths
1,156
Sq Ft
$232/Sq Ft
Est. Value
About This Home
This home is located at 1016 Cassandra St SW, Albuquerque, NM 87121 and is currently estimated at $267,834, approximately $231 per square foot. 1016 Cassandra St SW is a home located in Bernalillo County with nearby schools including Maryann Binford Elementary School, Truman Middle School, and Atrisco Heritage Academy High School.
Ownership History
Date
Name
Owned For
Owner Type
Purchase Details
Closed on
Sep 7, 2021
Sold by
Mcgibbon Linda M
Bought by
Lopez Elizabeth Victoria
Current Estimated Value
Home Financials for this Owner
Home Financials are based on the most recent Mortgage that was taken out on this home.
Original Mortgage
$225,060
Outstanding Balance
$204,341
Interest Rate
2.8%
Mortgage Type
VA
Estimated Equity
$63,493
Purchase Details
Closed on
Mar 17, 2005
Sold by
Vantage Builders Inc
Bought by
Mcgibbon Linda M
Home Financials for this Owner
Home Financials are based on the most recent Mortgage that was taken out on this home.
Original Mortgage
$95,575
Interest Rate
5.71%
Mortgage Type
Purchase Money Mortgage
Purchase Details
Closed on
Dec 6, 2004
Sold by
C & W Land Development Enterprises Inc
Bought by
Vantage Builders Inc
Create a Home Valuation Report for This Property
The Home Valuation Report is an in-depth analysis detailing your home's value as well as a comparison with similar homes in the area
Home Values in the Area
Average Home Value in this Area
Purchase History
| Date | Buyer | Sale Price | Title Company |
|---|---|---|---|
| Lopez Elizabeth Victoria | -- | Fidelity National Ttl Ins Co | |
| Mcgibbon Linda M | -- | Landamerica New Mexico Title | |
| Vantage Builders Inc | -- | Atc |
Source: Public Records
Mortgage History
| Date | Status | Borrower | Loan Amount |
|---|---|---|---|
| Open | Lopez Elizabeth Victoria | $225,060 | |
| Previous Owner | Mcgibbon Linda M | $95,575 |
Source: Public Records
Tax History Compared to Growth
Tax History
| Year | Tax Paid | Tax Assessment Tax Assessment Total Assessment is a certain percentage of the fair market value that is determined by local assessors to be the total taxable value of land and additions on the property. | Land | Improvement |
|---|---|---|---|---|
| 2025 | $2,086 | $50,915 | $9,469 | $41,446 |
| 2024 | $2,086 | $49,432 | $9,193 | $40,239 |
| 2023 | $2,051 | $47,993 | $8,926 | $39,067 |
| 2022 | $1,982 | $46,596 | $8,666 | $37,930 |
| 2021 | $1,415 | $33,421 | $10,045 | $23,376 |
| 2020 | $1,392 | $32,448 | $9,753 | $22,695 |
| 2019 | $1,351 | $31,503 | $9,469 | $22,034 |
| 2018 | $1,303 | $31,503 | $9,469 | $22,034 |
| 2017 | $1,263 | $30,586 | $9,193 | $21,393 |
| 2016 | $1,227 | $28,831 | $8,666 | $20,165 |
| 2015 | $28,831 | $28,831 | $8,666 | $20,165 |
| 2014 | $1,233 | $29,031 | $8,666 | $20,365 |
| 2013 | -- | $29,031 | $8,666 | $20,365 |
Source: Public Records
Map
Nearby Homes
- 921 Roma Dora Ln
- 0 Nwq Unser and Sage SW Unit 1081546
- 0 Sage Rd SW Unit 1085259
- 0 Sage & 90th St SW Unit 1083191
- 1209 Locura Rd SW
- 7605 Windsong Place SW
- 1815 Shadetree Dr SW
- 1420 Summerfield Place SW
- 9300 Jenny Ave SW
- 8809 Tenemaha Ave SW
- 1615 Quiet Desert Dr SW
- 780 Jaconita Place SW
- 3525 Tower Rd SW
- 9401 Reba Ave SW
- 8523 Vista Serena Ln SW
- 8600 Kimela Ct SW
- 8308 Vista Chamisa Ln SW
- 8315 Vista Chamisa Ln SW
- 0 Nna Unser&tower SW Unit 1081416
- 10737 Sabino Loop SW
- 1016 Cassandra St SW
- 1020 Cassandra St SW
- 1024 Cassandra St SW
- 1028 Cassandra St SW
- 1015 Cassandra St SW
- 1004 Cassandra St SW
- 1019 Cassandra St SW
- 1023 Cassandra St SW
- 1032 Cassandra St SW
- 1027 Cassandra St SW
- 8204 Sage Rd SW
- 1000 Cassandra St SW
- 1031 Cassandra St SW
- 1016 Alexandra St SW
- 1024 Alexandra St SW
- 1020 Alexandra St SW
- 1036 Cassandra St SW
- 1028 Alexandra St SW
- 8401 Desert Pointe Ave SW