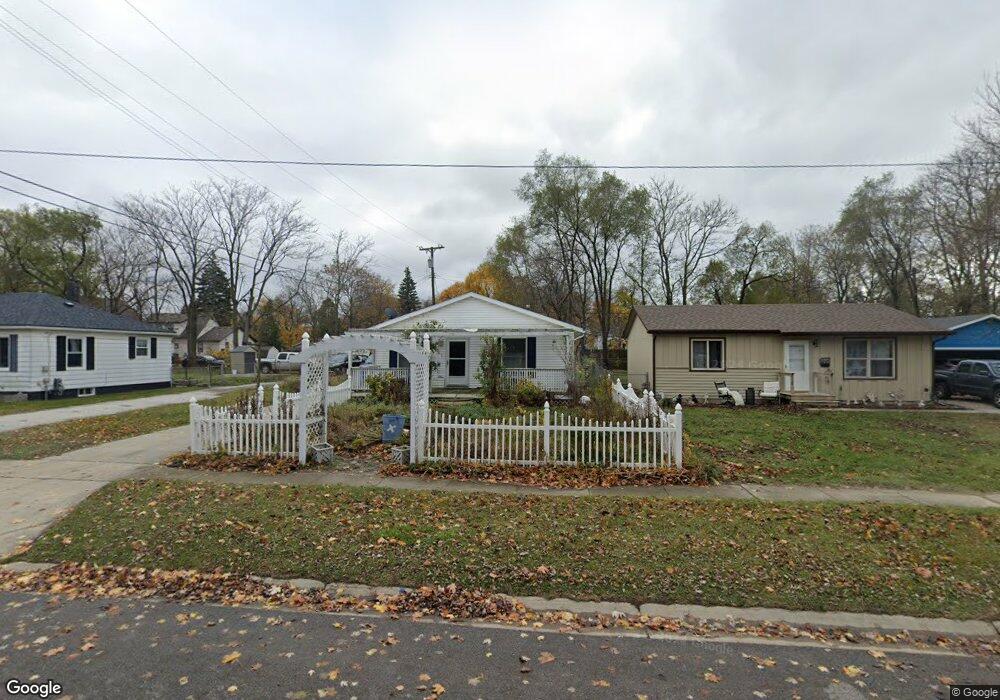
1016 Cypress St Port Huron, MI 48060
Estimated Value: $119,000 - $164,461
3
Beds
2
Baths
1,120
Sq Ft
$129/Sq Ft
Est. Value
About This Home
This home is located at 1016 Cypress St, Port Huron, MI 48060 and is currently estimated at $144,615, approximately $129 per square foot. 1016 Cypress St is a home located in St. Clair County with nearby schools including Woodrow Wilson Elementary School, Central Middle School, and Port Huron High School.
Ownership History
Date
Name
Owned For
Owner Type
Purchase Details
Closed on
Oct 9, 2019
Sold by
Liddiard Emily J C
Bought by
Cypress Haven Llc
Current Estimated Value
Purchase Details
Closed on
Dec 13, 2010
Sold by
Howell Matthew J and Howell Jacqueline M
Bought by
Liddiard Emily J
Purchase Details
Closed on
Jun 24, 2010
Sold by
Howell Jacqueline M and Howell Matthew J
Bought by
Fifth Third Mortgage Company
Create a Home Valuation Report for This Property
The Home Valuation Report is an in-depth analysis detailing your home's value as well as a comparison with similar homes in the area
Home Values in the Area
Average Home Value in this Area
Purchase History
| Date | Buyer | Sale Price | Title Company |
|---|---|---|---|
| Cypress Haven Llc | -- | None Listed On Document | |
| Liddiard Emily J | $35,000 | Maritime Title Agency Llc | |
| Fifth Third Mortgage Company | $29,000 | None Available |
Source: Public Records
Tax History Compared to Growth
Tax History
| Year | Tax Paid | Tax Assessment Tax Assessment Total Assessment is a certain percentage of the fair market value that is determined by local assessors to be the total taxable value of land and additions on the property. | Land | Improvement |
|---|---|---|---|---|
| 2025 | $2,244 | $73,600 | $0 | $0 |
| 2024 | $1,965 | $69,700 | $0 | $0 |
| 2023 | $1,860 | $62,100 | $0 | $0 |
| 2022 | $1,862 | $53,400 | $0 | $0 |
| 2021 | $1,778 | $45,100 | $0 | $0 |
| 2020 | $1,785 | $39,400 | $39,400 | $0 |
| 2019 | $1,753 | $27,700 | $0 | $0 |
| 2018 | $1,227 | $27,700 | $0 | $0 |
| 2017 | $1,097 | $26,100 | $0 | $0 |
| 2016 | $931 | $26,100 | $0 | $0 |
| 2015 | $932 | $25,900 | $25,900 | $0 |
| 2014 | $932 | $26,000 | $26,000 | $0 |
| 2013 | -- | $28,400 | $0 | $0 |
Source: Public Records
Map
Nearby Homes
- 1112 Minnie St
- 1831 11th St
- 1127 Minnie St
- 831 Bancroft St
- 738 Bancroft St
- 731 Bancroft St
- 730 Jenkinson St
- 823 Beard St
- 1309 Division St
- 1322 Division St
- 926 Griswold St
- 1132 Griswold St
- 1325 Division St
- 1623 8th St
- 2109 Military St
- 000 10th St
- 1103 White St
- 2444 Military St
- 1712 7th St
- 1207 White St