
Seller's Agent in 2021
Pamela Peacock
HomeSmart
(602) 505-0257
9 in this area
38 Total Sales
Estimated Value: $733,543
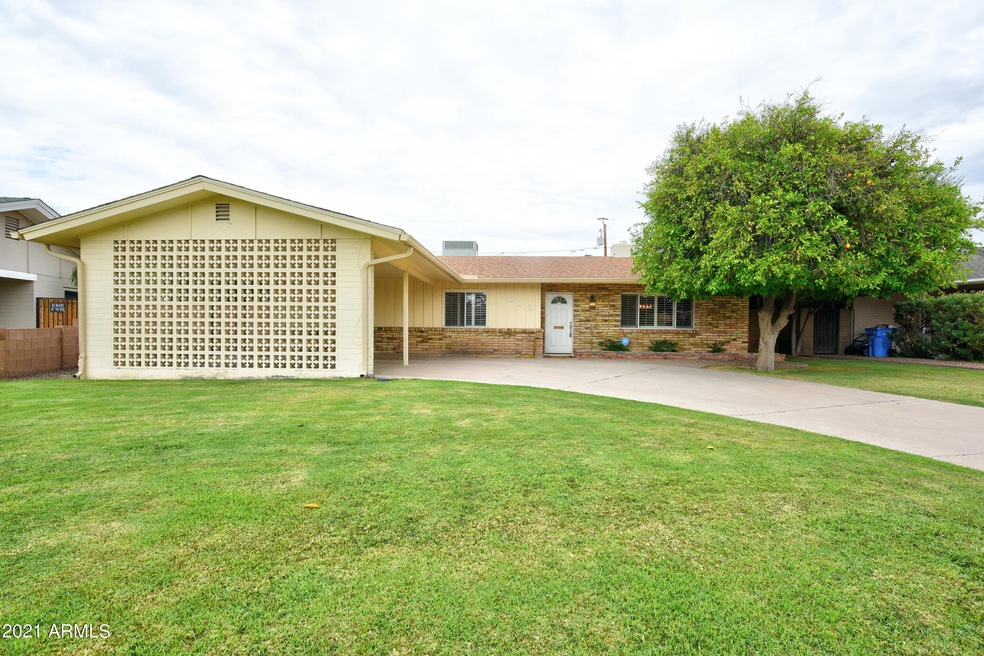
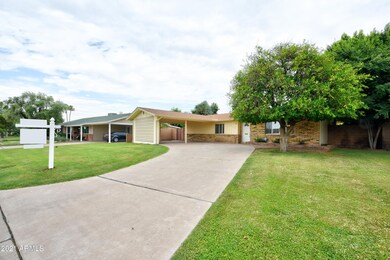
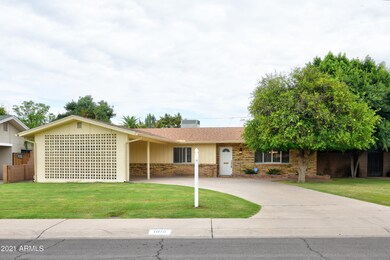
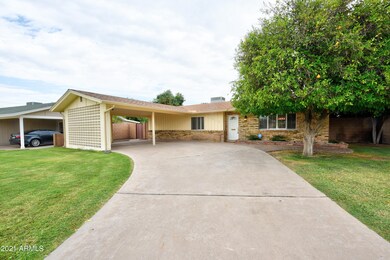
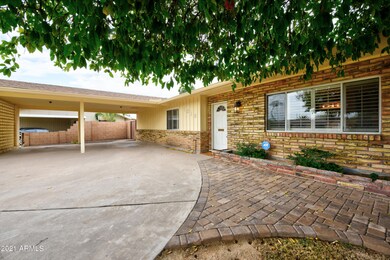
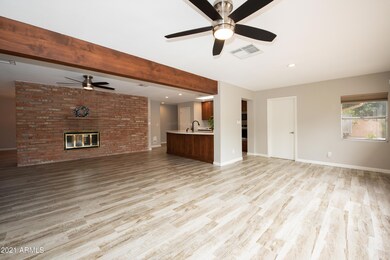
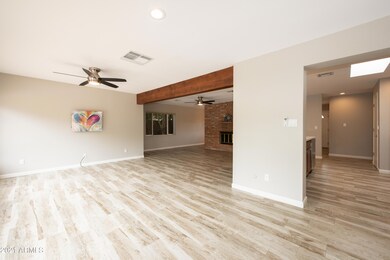
Stunning North Central mid-century rambler! This property offers a North/South oriented lot 10,555 sqft with RV gate .Walking distance to award-winning Madison Simis Elementary in highly desirable Northwood Manor subdivision. Beautifully updated and well maintained throughout! MOVE IN ready home i featuring ... Wood tile floors, updated kitchen including quartz counter tops. Great Room with 2 way FirePlace.. COOL POOL with Private & Spacious Backyard. Walking/biking distance to the Orchard, Lucy's , The Yard and some of the valley's most sought after restaurants. Schedule your showing MUST SEE FLOORPLAN
Last Buyer's Agent
Tyler Bush
RBR & Associates License #SA651519000
We collect this data history from publicly available records. To have your information removed, we recommend requesting removal directly through your county’s website.
We collect this data history from publicly available records. To have your information removed, we recommend requesting removal directly through your county’s website.
| Date | Buyer | Sale Price | Title Company |
|---|---|---|---|
| $630,000 | Chicago Title Agency | ||
| $442,200 | Empire West Title Agency Llc | ||
| $317,000 | Equity Title Agency Inc | ||
| -- | None Available |
We collect this data history from publicly available records. To have your information removed, we recommend requesting removal directly through your county’s website.
| Date | Status | Borrower | Loan Amount |
|---|---|---|---|
| Open | $548,000 | ||
| Previous Owner | $450,742 | ||
| Previous Owner | $452,652 | ||
| Previous Owner | $453,255 | ||
| Previous Owner | $453,099 | ||
| Previous Owner | $100,000 | ||
| Previous Owner | $257,500 | ||
| Previous Owner | $253,600 | ||
| Previous Owner | $100,000 |
We collect this data history from publicly available records. To have your information removed, we recommend requesting removal directly through your county’s website.
| Date | Event | Price | List to Sale | Price per Sq Ft | Prior Sale |
|---|---|---|---|---|---|
| 09/03/2021 09/03/21 | Sold | $630,000 | -5.8% | $340 / Sq Ft | |
| 07/21/2021 07/21/21 | Price Changed | $669,000 | -3.0% | $361 / Sq Ft | |
| 06/30/2021 06/30/21 | For Sale | $690,000 | +56.0% | $373 / Sq Ft | |
| 06/22/2018 06/22/18 | Sold | $442,200 | -0.2% | $233 / Sq Ft | View Prior Sale |
| 06/22/2018 06/22/18 | For Sale | $443,000 | 0.0% | $233 / Sq Ft | |
| 06/22/2018 06/22/18 | Price Changed | $443,000 | 0.0% | $233 / Sq Ft | |
| 06/04/2018 06/04/18 | Price Changed | $443,000 | +1.8% | $233 / Sq Ft | |
| 05/31/2018 05/31/18 | Pending | -- | -- | -- | |
| 04/12/2018 04/12/18 | Price Changed | $435,000 | -0.9% | $229 / Sq Ft | |
| 04/02/2018 04/02/18 | Price Changed | $439,000 | -2.2% | $231 / Sq Ft | |
| 02/16/2018 02/16/18 | Price Changed | $449,000 | -1.3% | $236 / Sq Ft | |
| 02/10/2018 02/10/18 | For Sale | $455,000 | 0.0% | $239 / Sq Ft | |
| 11/10/2016 11/10/16 | Rented | $2,200 | +0.2% | -- | |
| 11/09/2016 11/09/16 | Under Contract | -- | -- | -- | |
| 10/24/2016 10/24/16 | Price Changed | $2,195 | +7.1% | $1 / Sq Ft | |
| 10/20/2016 10/20/16 | Price Changed | $2,050 | -8.9% | $1 / Sq Ft | |
| 10/11/2016 10/11/16 | Price Changed | $2,250 | -2.2% | $1 / Sq Ft | |
| 10/02/2016 10/02/16 | For Rent | $2,300 | 0.0% | -- | |
| 04/28/2016 04/28/16 | Sold | $317,000 | -5.4% | $177 / Sq Ft | View Prior Sale |
| 03/28/2016 03/28/16 | Pending | -- | -- | -- | |
| 03/24/2016 03/24/16 | For Sale | $335,000 | 0.0% | $187 / Sq Ft | |
| 03/24/2016 03/24/16 | Price Changed | $335,000 | +3.1% | $187 / Sq Ft | |
| 02/08/2016 02/08/16 | Pending | -- | -- | -- | |
| 02/05/2016 02/05/16 | For Sale | $325,000 | -- | $181 / Sq Ft |
We collect this data history from publicly available records. To have your information removed, we recommend requesting removal directly through your county’s website.
| Year | Tax Paid | Tax Assessment Tax Assessment Total Assessment is a certain percentage of the fair market value that is determined by local assessors to be the total taxable value of land and additions on the property. | Land | Improvement |
|---|---|---|---|---|
| 2025 | $3,143 | $27,412 | ||
| 2024 | $2,902 | $26,107 | ||
| 2023 | $2,902 | $52,260 | $10,450 | $41,810 |
| 2022 | $2,809 | $37,470 | $7,490 | $29,980 |
| 2021 | $2,866 | $33,180 | $6,630 | $26,550 |
| 2020 | $2,820 | $32,710 | $6,540 | $26,170 |
| 2019 | $2,756 | $29,430 | $5,880 | $23,550 |
| 2018 | $2,683 | $28,950 | $5,790 | $23,160 |
| 2017 | $2,902 | $27,710 | $5,540 | $22,170 |
| 2016 | $2,802 | $25,910 | $5,180 | $20,730 |
| 2015 | $2,284 | $24,060 | $4,810 | $19,250 |
Seller's Agent in 2021
Pamela Peacock
HomeSmart
(602) 505-0257
9 in this area
38 Total Sales
T
Buyer's Agent in 2021
Tyler Bush
RBR & Associates
Seller's Agent in 2018
Erin Murray
DeLex Realty
(480) 274-3410
2 in this area
28 Total Sales
D
Seller's Agent in 2016
Daradee Olson
Realty One Group
(480) 242-4430
17 Total Sales
Seller's Agent in 2016
Patrick Jones
Brokers Hub Realty, LLC
(480) 251-2215
2 in this area
23 Total Sales
Seller Co-Listing Agent in 2016
Randi Garcia
New Nest Group
(602) 319-8685
2 in this area
56 Total Sales
Source: Arizona Regional Multiple Listing Service (ARMLS)
MLS Number: 6259601
APN: 160-28-122
Disclaimer: Certain information contained herein is derived from information provided by parties other than Homes.com. All information provided is deemed reliable, but is not guaranteed to be accurate and should be independently verified.
![]() All information should be verified by the recipient and none is guaranteed as accurate by ARMLS
All information should be verified by the recipient and none is guaranteed as accurate by ARMLS
Listing Information presented by local MLS brokerage: Ten-X, local REALTOR®- Arlene Richardson - (888)-952-6393
Ask me questions while you tour the home.