1016 E Thomas St Sherman, TX 75090
Estimated payment $357/month
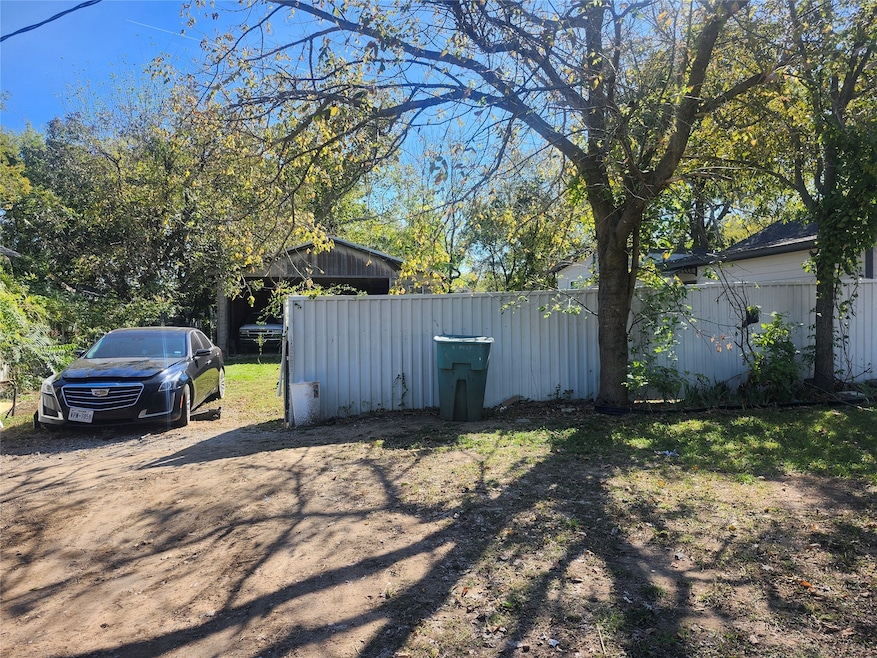
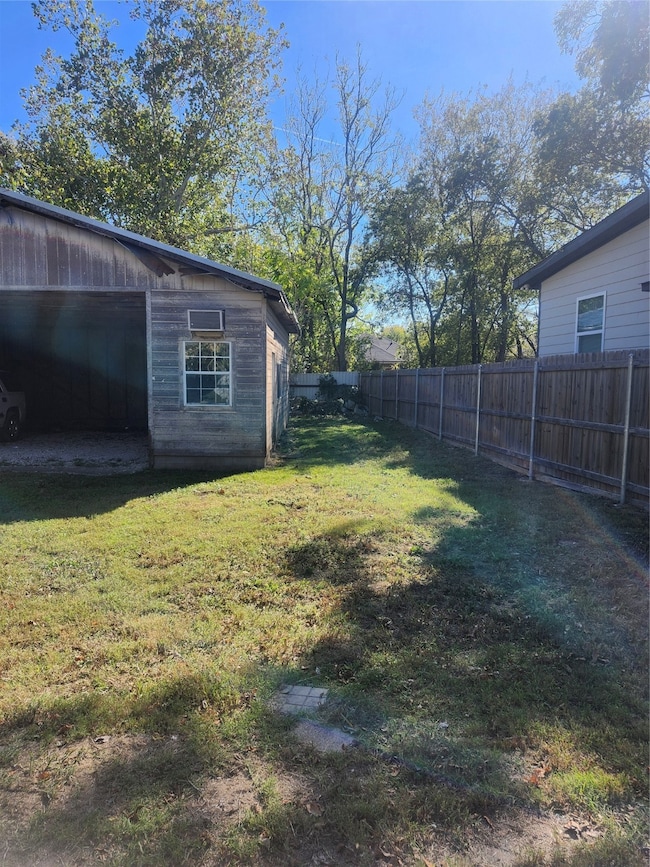
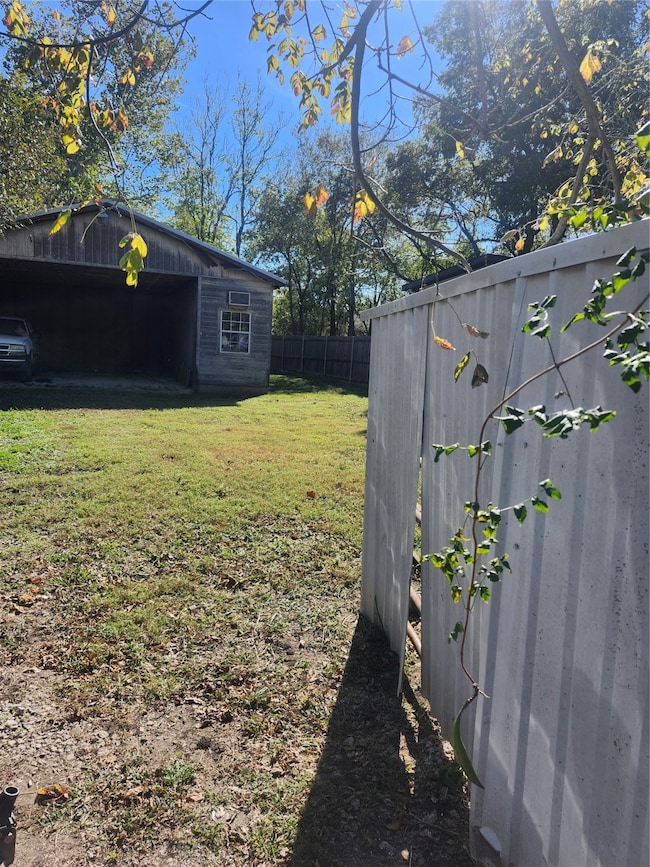
About This Lot
Flat, Clean Lot in the Growing City of Sherman! Property has a garage , as well as being completely enclosed with a privacy fence Don’t miss this great opportunity to own a flat, clean lot in the rapidly expanding city of Sherman, Texas. Enjoy easy access to Dallas and nearby airports, making this location ideal for commuters or investors alike. Perfect for building your new home or as a smart investment property for future growth.
Listing Agent
Real Estate Shoppe TX, LLC Brokerage Phone: 940-336-4663 License #0638921 Listed on: 11/04/2025
Property Details
Property Type
- Land
Est. Annual Taxes
- $1,339
Schools
- Dillingham Elementary School
- Sherman Middle School
- Sherman High School
Additional Features
- 5,489 Sq Ft Lot
- City Lot
Community Details
- Elliotts W Add Subdivision
Listing and Financial Details
- Legal Lot and Block 2 / 30
- Assessor Parcel Number 165348
Map
Home Values in the Area
Average Home Value in this Area
Tax History
| Year | Tax Paid | Tax Assessment Tax Assessment Total Assessment is a certain percentage of the fair market value that is determined by local assessors to be the total taxable value of land and additions on the property. | Land | Improvement |
|---|---|---|---|---|
| 2025 | $1,210 | $61,042 | $42,185 | $18,857 |
| 2024 | $1,210 | $55,148 | $35,915 | $19,233 |
| 2023 | $1,121 | $51,045 | $32,175 | $18,870 |
| 2022 | $978 | $41,710 | $24,200 | $17,510 |
| 2021 | $720 | $28,722 | $14,300 | $14,422 |
| 2020 | $251 | $9,570 | $9,570 | $0 |
| 2019 | $219 | $8,140 | $8,140 | $0 |
| 2018 | $135 | $5,390 | $5,390 | $0 |
| 2017 | $75 | $3,025 | $3,025 | $0 |
| 2016 | $63 | $2,530 | $2,530 | $0 |
| 2015 | $63 | $2,530 | $2,530 | $0 |
| 2014 | $63 | $2,530 | $2,530 | $0 |
Property History
| Date | Event | Price | List to Sale | Price per Sq Ft | Prior Sale |
|---|---|---|---|---|---|
| 11/04/2025 11/04/25 | For Sale | $46,000 | +21.4% | -- | |
| 05/22/2023 05/22/23 | Sold | -- | -- | -- | View Prior Sale |
| 04/29/2023 04/29/23 | Pending | -- | -- | -- | |
| 04/27/2023 04/27/23 | For Sale | $37,900 | 0.0% | -- | |
| 02/22/2023 02/22/23 | Off Market | -- | -- | -- | |
| 01/19/2023 01/19/23 | Price Changed | $37,900 | -4.1% | -- | |
| 01/05/2023 01/05/23 | Price Changed | $39,500 | -6.0% | -- | |
| 12/16/2022 12/16/22 | Price Changed | $42,000 | -14.3% | -- | |
| 12/04/2022 12/04/22 | For Sale | $49,000 | -- | -- |
Purchase History
| Date | Type | Sale Price | Title Company |
|---|---|---|---|
| Special Warranty Deed | -- | None Listed On Document | |
| Warranty Deed | -- | None Listed On Document | |
| Warranty Deed | -- | None Listed On Document | |
| Warranty Deed | -- | None Listed On Document | |
| Warranty Deed | -- | None Listed On Document | |
| Warranty Deed | -- | None Listed On Document | |
| Warranty Deed | -- | None Listed On Document |
Source: North Texas Real Estate Information Systems (NTREIS)
MLS Number: 21103963
APN: 165348
Disclaimer: Certain information contained herein is derived from information provided by parties other than Homes.com. All information provided is deemed reliable, but is not guaranteed to be accurate and should be independently verified.
![]() Listing information provided in part by the North Texas Real Estate Information Systems, Inc, for personal, non-commercial use by viewers of this site and may not be reproduced or redistributed. All information is deemed reliable but not guaranteed. Copyright © NTREIS 2026. All rights reserved
Listing information provided in part by the North Texas Real Estate Information Systems, Inc, for personal, non-commercial use by viewers of this site and may not be reproduced or redistributed. All information is deemed reliable but not guaranteed. Copyright © NTREIS 2026. All rights reserved
- 609 E Epstein St
- 1116 E Epstein St
- 904 S Gribble St
- 915 E Spring St
- 1120 E Wells Ave
- 620 S Charles St Unit 622
- TBD S Gribble St
- 1115 S Hazelwood St
- 1122 S Hazelwood St
- 1215 S Vaden St
- 908 S Throckmorton St
- 604 S Maxey St
- 1209 S Maxey St
- 615 S Throckmorton St
- 702 S Throckmorton St
- 603 E Thomas St
- 422 S Hazelwood St
- 1431 E Wells Ave
- 419 S Willow St
- 1008 S 1st St
- 1014 E Epstein St
- 1010 E Epstein St
- 815 S Willow St
- 413 S Willow St
- 1429 E Odneal St
- 1124 S Hazelwood St
- 1006 S Throckmorton St
- 923 S First St
- 410 S Vaden St Unit A
- 613 E Rosedale St
- 1203 S First St
- 902 E Cherry St
- 515 S 1st St
- 515 S 1st St Unit 8
- 1529 E King St
- 1201 E Lamar St
- 710 E Lamar St
- 1217 E Lamar St
- 908 E Houston St
- 906 E Houston St Unit 908

Ask me questions while you tour the home.