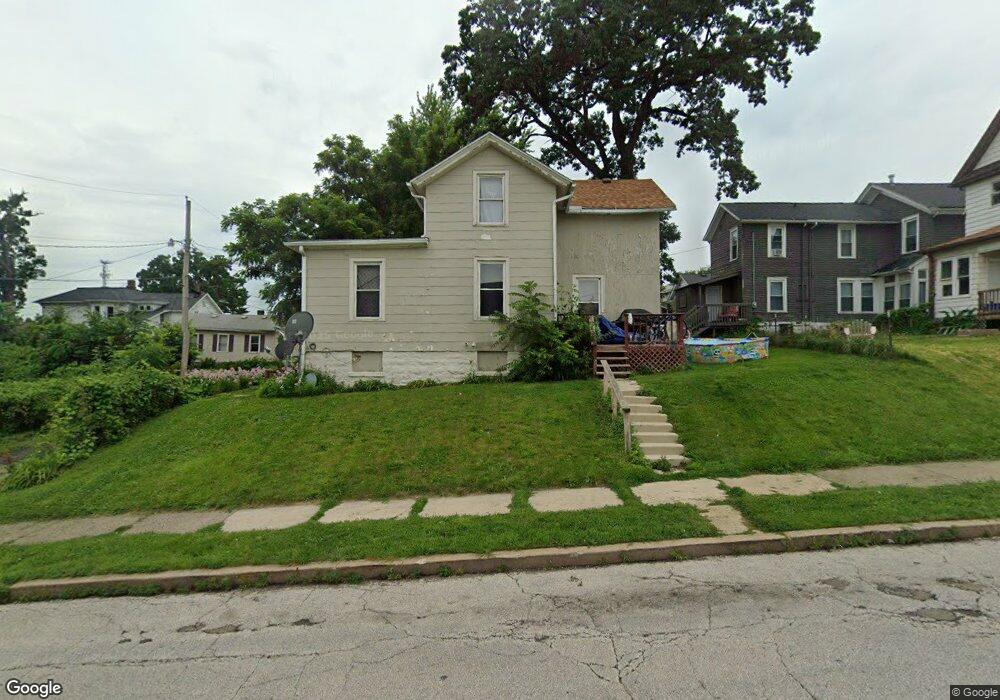
1016 Iowa St Davenport, IA 52803
Central Davenport NeighborhoodEstimated Value: $68,000 - $86,000
2
Beds
1
Bath
1,147
Sq Ft
$65/Sq Ft
Est. Value
About This Home
This home is located at 1016 Iowa St, Davenport, IA 52803 and is currently estimated at $74,237, approximately $64 per square foot. 1016 Iowa St is a home located in Scott County with nearby schools including Walnut Hill Elementary School, Crofton Elementary School, and Casey County Middle School.
Ownership History
Date
Name
Owned For
Owner Type
Purchase Details
Closed on
Jan 31, 2025
Sold by
Sountris Kyle M
Bought by
Bolt Motors Inc
Current Estimated Value
Home Financials for this Owner
Home Financials are based on the most recent Mortgage that was taken out on this home.
Original Mortgage
$47,500
Outstanding Balance
$47,176
Interest Rate
6.91%
Mortgage Type
New Conventional
Estimated Equity
$27,061
Purchase Details
Closed on
Nov 1, 2024
Sold by
Sountris Vivan L
Bought by
Sountris Kyle M
Purchase Details
Closed on
Sep 30, 2010
Sold by
The Secretary Of Housing & Urban Develop
Bought by
Sountris Vivan Leroy
Purchase Details
Closed on
May 14, 2008
Sold by
Porche Donald and Porche Dorothy D
Bought by
Flagstar Bank Fsb
Purchase Details
Closed on
Feb 15, 2007
Sold by
Speer Roland A and Speer Carol J
Bought by
Porche Donald
Home Financials for this Owner
Home Financials are based on the most recent Mortgage that was taken out on this home.
Original Mortgage
$54,568
Interest Rate
6.27%
Mortgage Type
FHA
Create a Home Valuation Report for This Property
The Home Valuation Report is an in-depth analysis detailing your home's value as well as a comparison with similar homes in the area
Home Values in the Area
Average Home Value in this Area
Purchase History
| Date | Buyer | Sale Price | Title Company |
|---|---|---|---|
| Bolt Motors Inc | $63,000 | None Listed On Document | |
| Sountris Kyle M | -- | None Listed On Document | |
| Sountris Vivan Leroy | -- | None Available | |
| Flagstar Bank Fsb | $67,417 | None Available | |
| Porche Donald | $55,000 | None Available |
Source: Public Records
Mortgage History
| Date | Status | Borrower | Loan Amount |
|---|---|---|---|
| Open | Bolt Motors Inc | $47,500 | |
| Previous Owner | Porche Donald | $54,568 |
Source: Public Records
Tax History Compared to Growth
Tax History
| Year | Tax Paid | Tax Assessment Tax Assessment Total Assessment is a certain percentage of the fair market value that is determined by local assessors to be the total taxable value of land and additions on the property. | Land | Improvement |
|---|---|---|---|---|
| 2025 | $976 | $62,290 | $6,830 | $55,460 |
| 2024 | $1,987 | $54,640 | $6,830 | $47,810 |
| 2023 | $1,406 | $54,640 | $6,830 | $47,810 |
| 2022 | $1,097 | $43,950 | $3,120 | $40,830 |
| 2021 | $944 | $43,950 | $3,120 | $40,830 |
| 2020 | $816 | $37,140 | $3,120 | $34,020 |
| 2019 | $968 | $37,600 | $3,120 | $34,480 |
| 2018 | $1,114 | $37,600 | $3,120 | $34,480 |
| 2017 | $199 | $35,780 | $3,120 | $32,660 |
| 2016 | $1,294 | $35,780 | $0 | $0 |
| 2015 | $784 | $36,320 | $0 | $0 |
| 2014 | $806 | $36,320 | $0 | $0 |
| 2013 | $792 | $0 | $0 | $0 |
| 2012 | -- | $33,020 | $2,950 | $30,070 |
Source: Public Records
Map
Nearby Homes
- 327 E 11th St
- 329 E 11th St
- 323 E 11th St
- 324 E 10th St
- 322 E 10th St
- 320 E 10th St
- 313 E 11th St
- 313 E 11th St Unit 315
- 318 E 10th St
- 309 E 11th St
- 316 E 10th St
- 312 E 10th St
- 1102 Iowa St
- 307 E 11th St
- 307 E 11th St Unit 305 & 307
- 310 E 10th St
- 305 E 11th St
- 318 E 11th St
- 1025 Pershing Ave
- 320 E 11th St