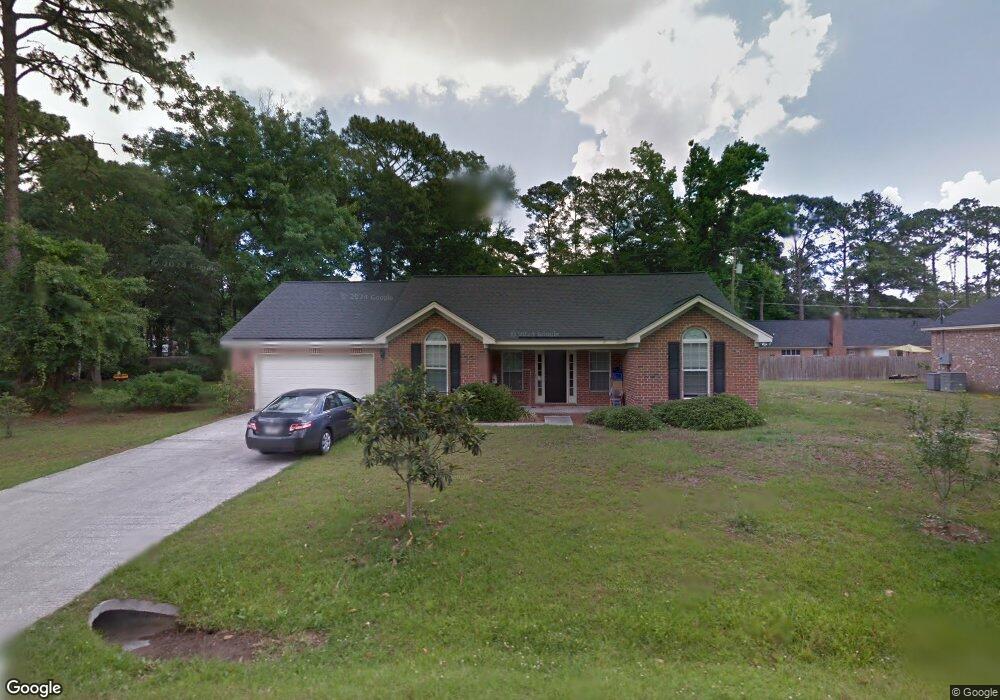
1016 Lora St Savannah, GA 31410
Whitemarsh Island NeighborhoodEstimated Value: $465,000 - $487,000
3
Beds
2
Baths
1,826
Sq Ft
$260/Sq Ft
Est. Value
About This Home
This home is located at 1016 Lora St, Savannah, GA 31410 and is currently estimated at $475,512, approximately $260 per square foot. 1016 Lora St is a home located in Chatham County with nearby schools including Marshpoint Elementary School, Coastal Middle School, and Islands High School.
Ownership History
Date
Name
Owned For
Owner Type
Purchase Details
Closed on
Aug 21, 2020
Sold by
Wu Le J
Bought by
Nguyen Tuong K and Tran Lua T
Current Estimated Value
Home Financials for this Owner
Home Financials are based on the most recent Mortgage that was taken out on this home.
Original Mortgage
$187,500
Outstanding Balance
$166,326
Interest Rate
3%
Mortgage Type
New Conventional
Estimated Equity
$309,186
Purchase Details
Closed on
Dec 3, 2019
Sold by
Wu Song Jin
Bought by
Wu Le J
Purchase Details
Closed on
Feb 28, 2006
Sold by
Not Provided
Bought by
Wu Song Jin and Wu J
Home Financials for this Owner
Home Financials are based on the most recent Mortgage that was taken out on this home.
Original Mortgage
$227,900
Interest Rate
5.81%
Mortgage Type
New Conventional
Purchase Details
Closed on
Jan 20, 2005
Sold by
Callaway Robert
Bought by
Callaway Construction Llc
Create a Home Valuation Report for This Property
The Home Valuation Report is an in-depth analysis detailing your home's value as well as a comparison with similar homes in the area
Home Values in the Area
Average Home Value in this Area
Purchase History
| Date | Buyer | Sale Price | Title Company |
|---|---|---|---|
| Nguyen Tuong K | $250,000 | -- | |
| Wu Le J | -- | -- | |
| Wu Song Jin | -- | -- | |
| Callaway Construction Llc | -- | -- |
Source: Public Records
Mortgage History
| Date | Status | Borrower | Loan Amount |
|---|---|---|---|
| Open | Nguyen Tuong K | $187,500 | |
| Previous Owner | Wu Song Jin | $227,900 |
Source: Public Records
Tax History Compared to Growth
Tax History
| Year | Tax Paid | Tax Assessment Tax Assessment Total Assessment is a certain percentage of the fair market value that is determined by local assessors to be the total taxable value of land and additions on the property. | Land | Improvement |
|---|---|---|---|---|
| 2025 | $7,911 | $211,360 | $30,000 | $181,360 |
| 2024 | $7,911 | $196,400 | $20,000 | $176,400 |
| 2023 | $5,669 | $164,240 | $20,000 | $144,240 |
| 2022 | $3,563 | $150,480 | $20,000 | $130,480 |
| 2021 | $3,510 | $100,000 | $11,680 | $88,320 |
| 2020 | $3,882 | $133,040 | $14,000 | $119,040 |
| 2019 | $4,015 | $124,040 | $14,000 | $110,040 |
| 2018 | $3,295 | $111,640 | $14,000 | $97,640 |
| 2017 | $3,175 | $112,120 | $14,000 | $98,120 |
| 2016 | $3,265 | $103,040 | $22,360 | $80,680 |
| 2015 | $3,284 | $103,880 | $22,360 | $81,520 |
| 2014 | $4,788 | $104,160 | $0 | $0 |
Source: Public Records
Map
Nearby Homes
- 1024 Cheryl St
- 1110 Juanita St
- 911 Juanita St
- 906 Tara St
- 000 Perry Cove
- 000000 Perry Cove
- 310 Mapmaker Ln
- 115 Turnbuckle Ct
- 156 Ropemaker Ln
- 303 Mapmaker Ln
- 207 Barley Dr
- 121 Summer Winds Dr
- 129 Ropemaker Ln
- 131 Summer Winds Dr
- 128 Mapmaker Ln
- 29 Penrose Dr
- 115 Binnacle Ct
- 33 Penrose Dr
- 1723 Whitemarsh Way
- 1733 Whitemarsh Way
- 1015 Charlene St
- 1018 Lora St
- 1017 Charlene St
- 1013 Charlene St
- 1013 Lora St
- 1009 Charlene St
- 1012 Lora St
- 1011 Charlene St
- 1017 Lora St
- 1011 Lora St
- 1016 Debbie St
- 1016 Charlene St
- 1014 Debbie St
- 1102 Lora St
- 1014 Charlene St
- 1101 Charlene St
- 1018 Charlene Dr
- 1012 Debbie St
- 1010 Lora St
- 1101 Lora St